---
sidebar_label: Usage and quotas
toc_max_heading_level: 3
doc_id: f2a8b4e1-5c93-4d7a-b026-8e3f1a9c5d42
description: >-
Monitor AI assistant quota consumption for your organization and individual
users. View tokens and concurrent session usage against daily and monthly limits.
keywords:
- AI usage
- quota
- rate limits
- tokens
- concurrent sessions
- platform settings
- AI assistant limits
---
# AI usage and quotas
:::info 🚀 Early release
AI-powered features are in early release and may not be available in your organization yet. If you'd like to try them or want to know more, [reach out to us](https://docs.nullplatform.com/docs/support) and we'll get you set up.
:::
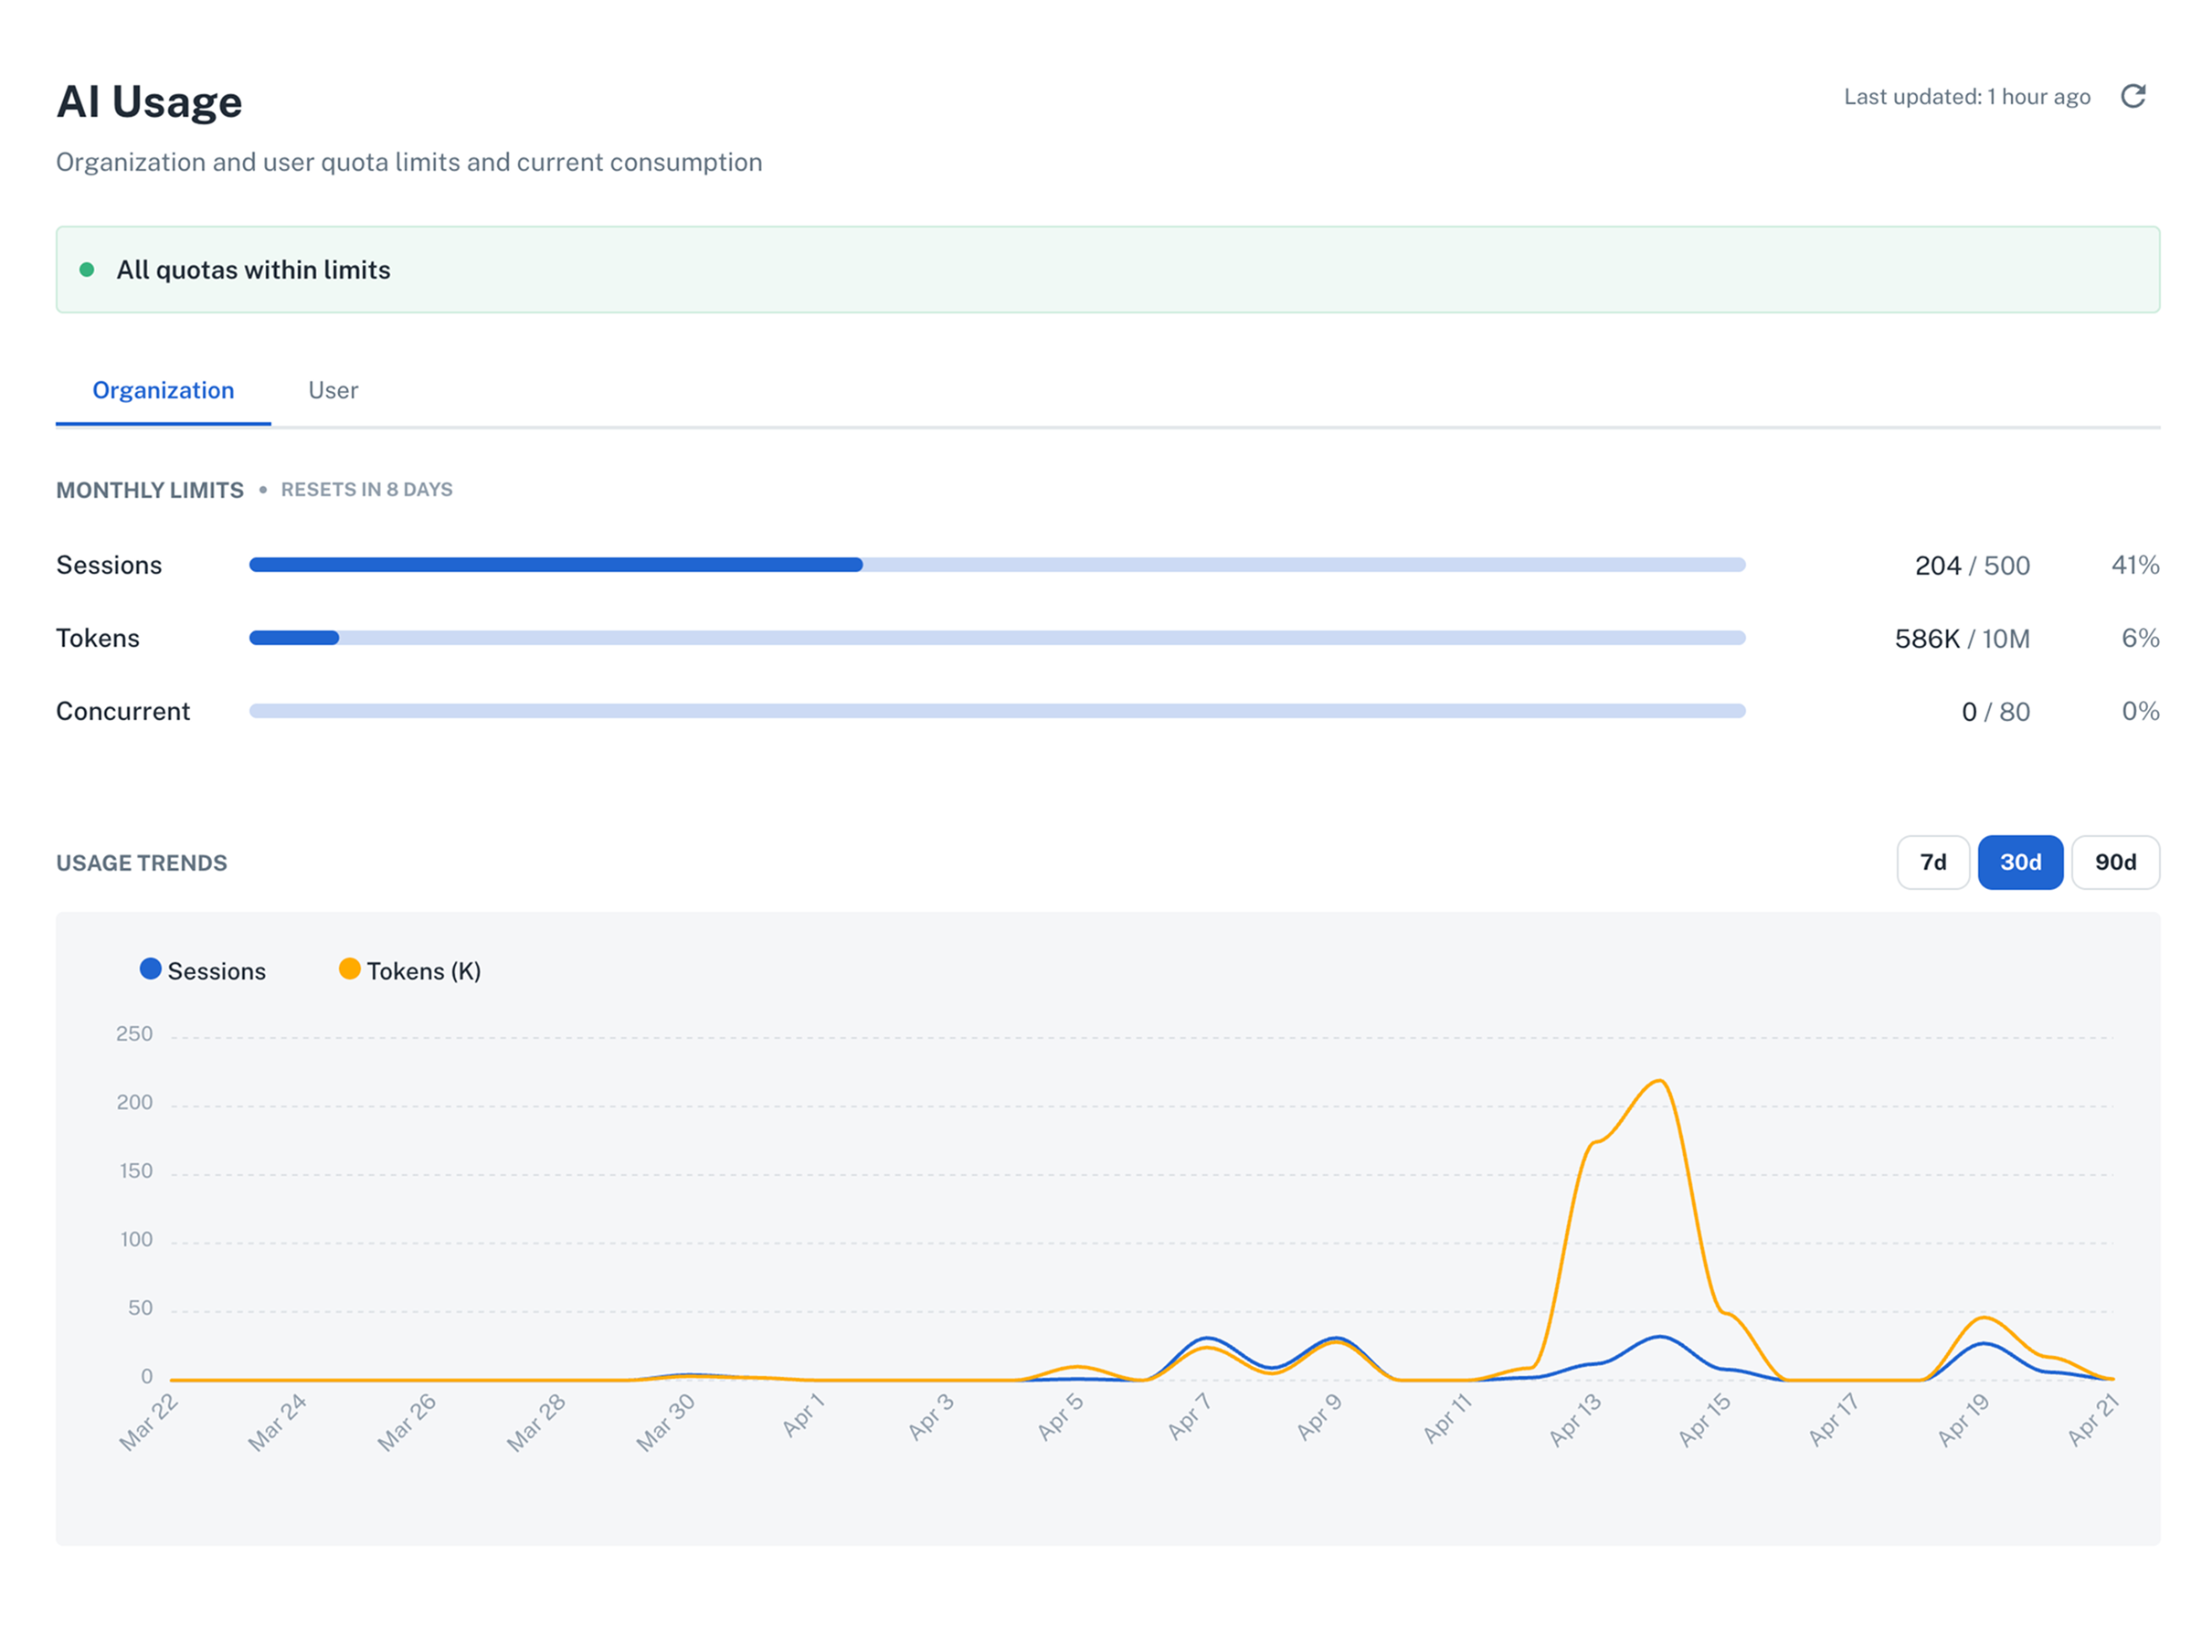
The **AI Usage** page in Platform Settings shows how much of the AI assistant quota your organization and individual users have consumed. Use it to check current consumption against daily and monthly limits and to spot when anyone is approaching or has exceeded their quota.
To open it, go to **Platform Settings > AI Usage**.
## What gets tracked
Three metrics track current and historical consumption across daily and monthly time windows:
| Metric | What it counts |
|---|---|
| **Sessions** | Total AI assistant sessions started in the window |
| **Tokens** | Total tokens processed (input + output) across all AI sessions in the window |
| **Concurrent** | Active AI sessions running at the same time, right now |
Each metric shows current usage versus the configured limit (for example, `586K / 10M`) and a percentage progress bar that changes color as consumption grows.
## Organization and user views
Use the **Organization** and **User** tabs to switch between the shared org quota and your individual quota. If either is exceeded, the AI assistant is blocked until the window resets.
:::note
Limits are configured by your organization admin. If you need your quotas adjusted, contact your admin.
:::
### Status indicators
The banner and progress bars change color as consumption grows: green when within limits, yellow when approaching (~80%), and orange/red when a limit is reached. When **Limit reached** is shown, the AI assistant is blocked until the window resets or an admin raises the limit.
### Usage trends
Below the current limits, the **Usage Trends** chart shows historical consumption over 7, 30, or 90 days. Use the toggle buttons at the top right of the chart to switch between windows.
The chart plots tokens and sessions over time, which helps identify peak usage periods and plan capacity accordingly.
## Rate limits in the AI chat
The AI assistant chat panel also surfaces a live summary of remaining quota. At the bottom of the chat, a status indicator shows the metric closest to its limit and the percentage remaining.
Expand the indicator to see Daily and Monthly limits side by side, with color-coded progress bars for each metric. This lets you check how much quota remains without leaving your current view.
 :::note
Limits are configured by your organization admin. If you need your quotas adjusted, contact your admin.
:::
### Status indicators
The banner and progress bars change color as consumption grows: green when within limits, yellow when approaching (~80%), and orange/red when a limit is reached. When **Limit reached** is shown, the AI assistant is blocked until the window resets or an admin raises the limit.
### Usage trends
Below the current limits, the **Usage Trends** chart shows historical consumption over 7, 30, or 90 days. Use the toggle buttons at the top right of the chart to switch between windows.
The chart plots tokens and sessions over time, which helps identify peak usage periods and plan capacity accordingly.
## Rate limits in the AI chat
The AI assistant chat panel also surfaces a live summary of remaining quota. At the bottom of the chat, a status indicator shows the metric closest to its limit and the percentage remaining.
Expand the indicator to see Daily and Monthly limits side by side, with color-coded progress bars for each metric. This lets you check how much quota remains without leaving your current view.
:::note
Limits are configured by your organization admin. If you need your quotas adjusted, contact your admin.
:::
### Status indicators
The banner and progress bars change color as consumption grows: green when within limits, yellow when approaching (~80%), and orange/red when a limit is reached. When **Limit reached** is shown, the AI assistant is blocked until the window resets or an admin raises the limit.
### Usage trends
Below the current limits, the **Usage Trends** chart shows historical consumption over 7, 30, or 90 days. Use the toggle buttons at the top right of the chart to switch between windows.
The chart plots tokens and sessions over time, which helps identify peak usage periods and plan capacity accordingly.
## Rate limits in the AI chat
The AI assistant chat panel also surfaces a live summary of remaining quota. At the bottom of the chat, a status indicator shows the metric closest to its limit and the percentage remaining.
Expand the indicator to see Daily and Monthly limits side by side, with color-coded progress bars for each metric. This lets you check how much quota remains without leaving your current view.