---
title: What you can ask about
sidebar_label: What you can ask about
toc_max_heading_level: 3
doc_id: e5a7b2c6-0f81-4d4e-a261-7a1e9f5b3d48
description: >-
Get real-time visibility into team activity, deployments, costs, and
security. Ask questions in plain language, get dashboards backed by live
data, and use the AI chat to analyze the results.
keywords:
- management insights
- team velocity
- deployment metrics
- cost analysis
- security posture
- dashboard analysis
---
# What you can ask about
Ask a question in the chat panel and nullplatform generates a dashboard backed by live data. The assistant understands your organization's hierarchy and only shows what you have access to. Here's what teams typically build with it.
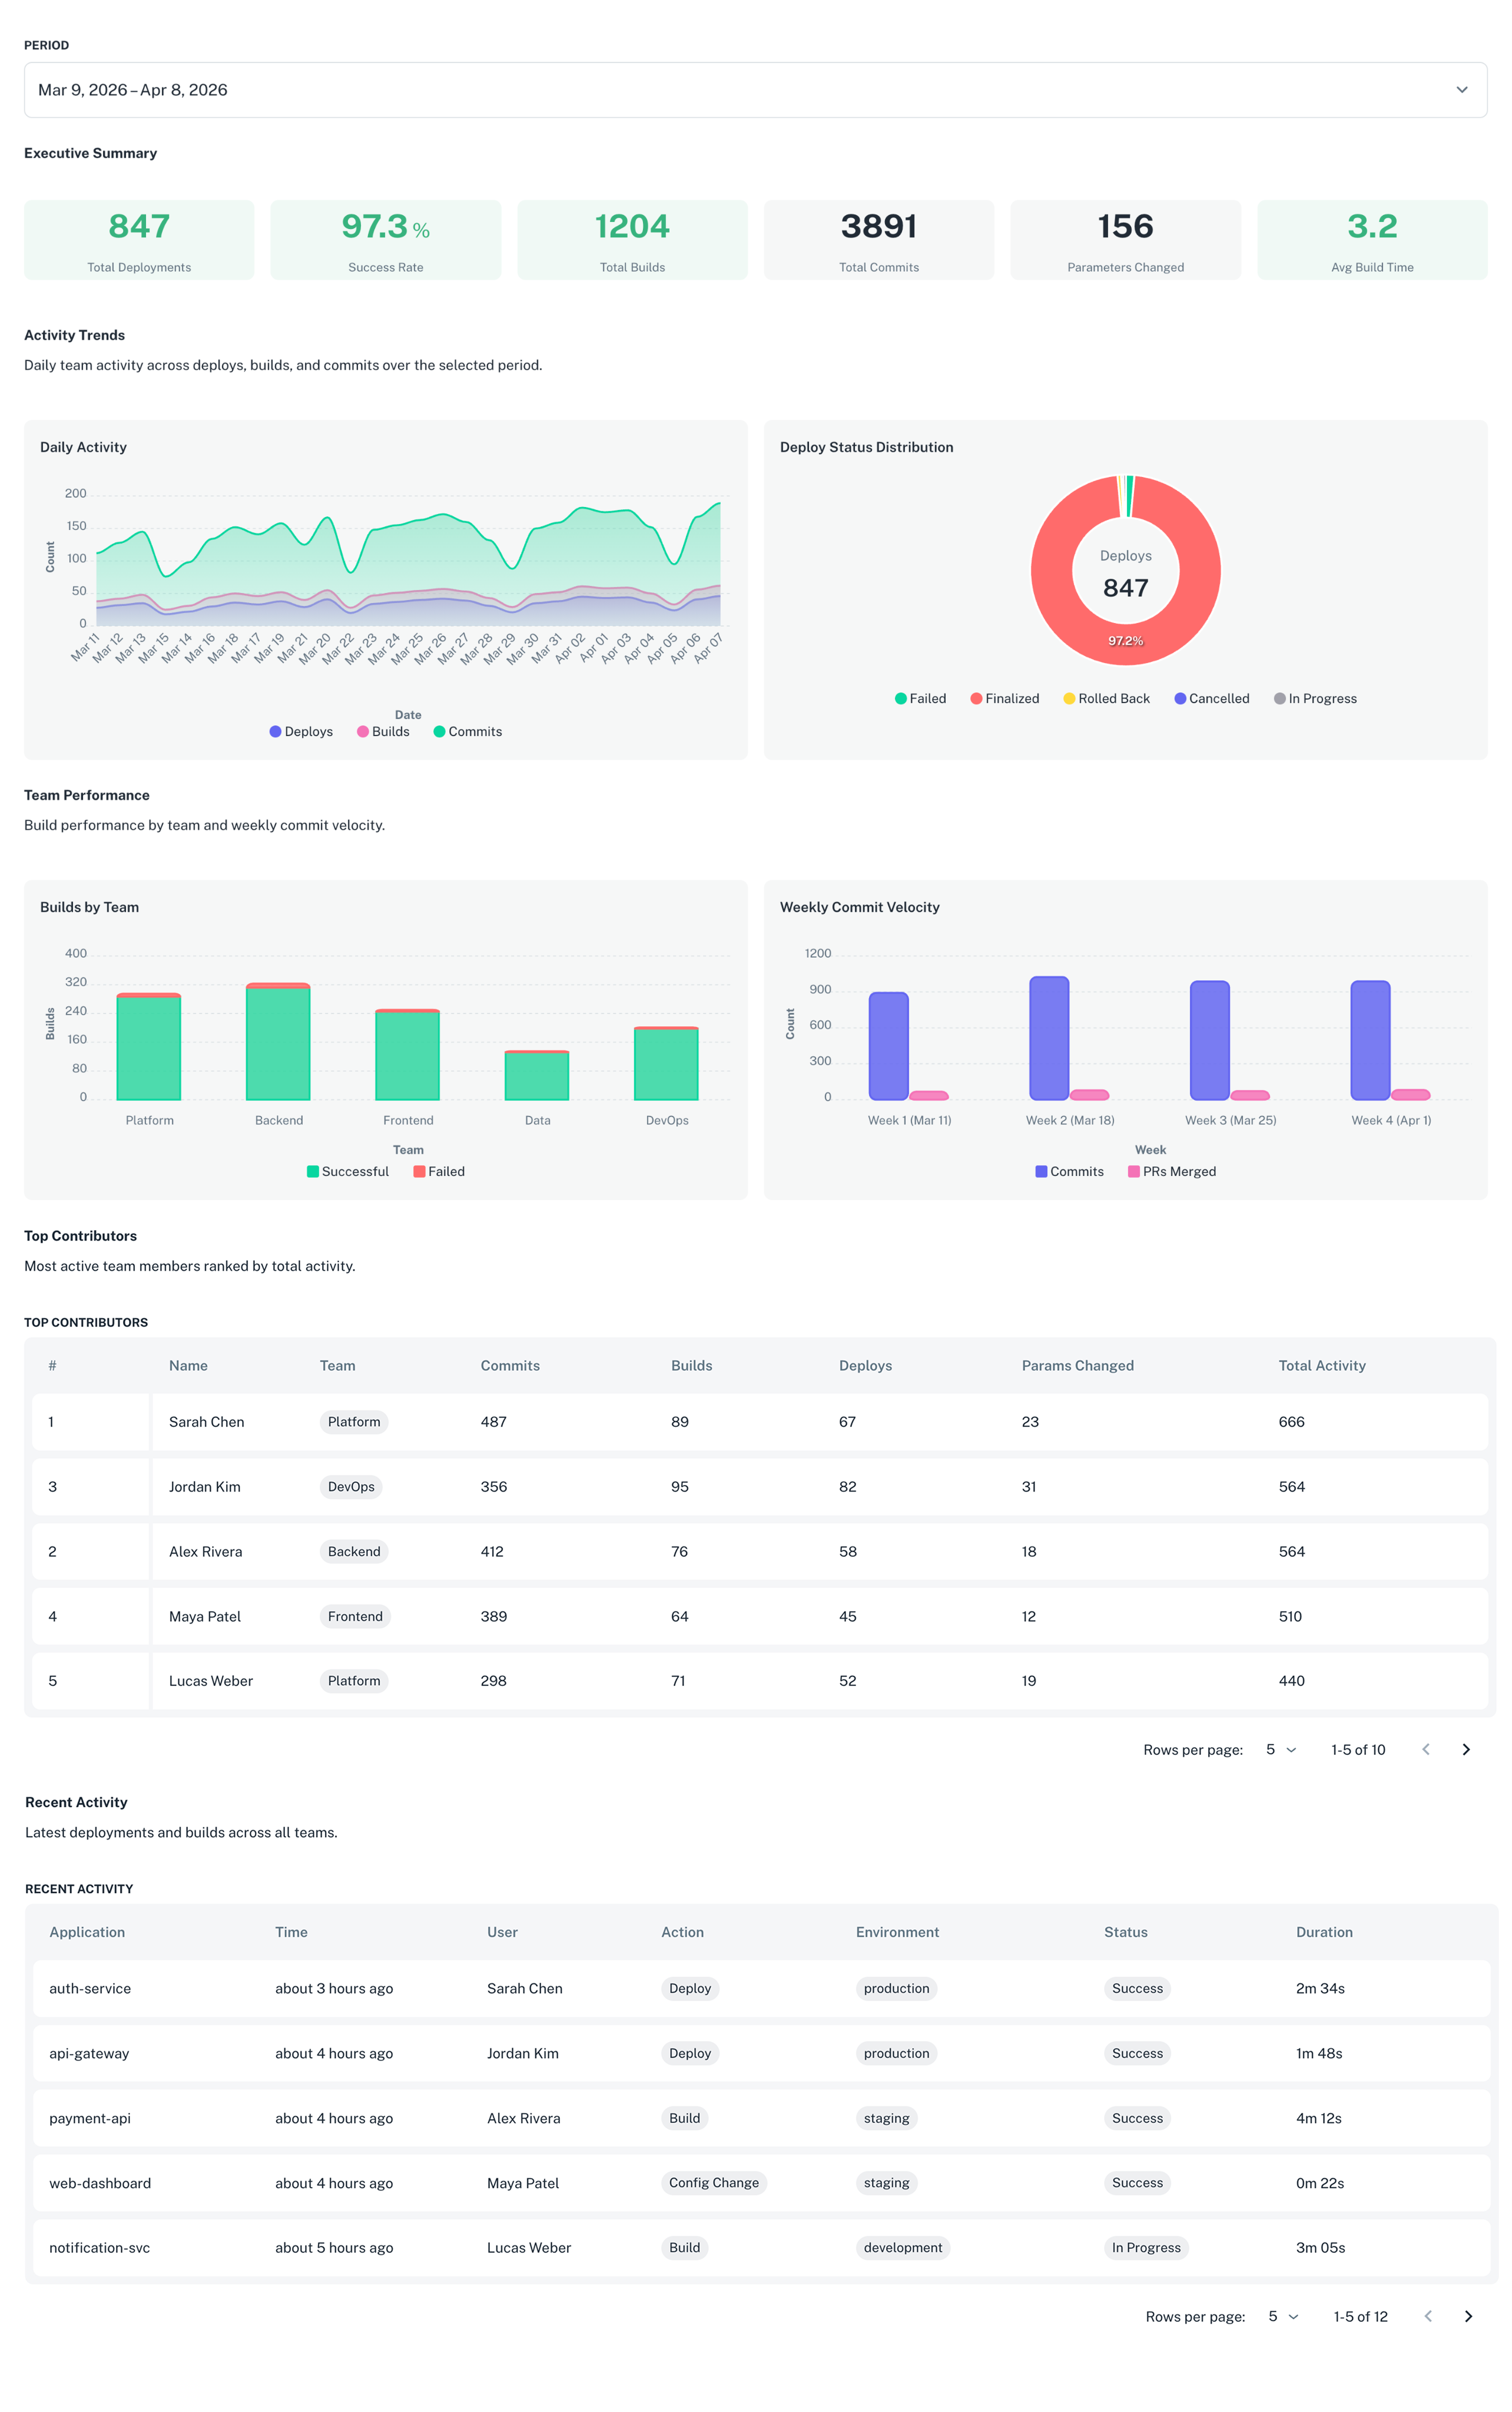
## Team activity and velocity
Track what your teams are shipping: builds, deployments, parameters, and contributor activity over any time range. Try *"Show me all team activity for the last 4 weeks: deploys, builds, and parameters"*.
 ## Manager scorecards
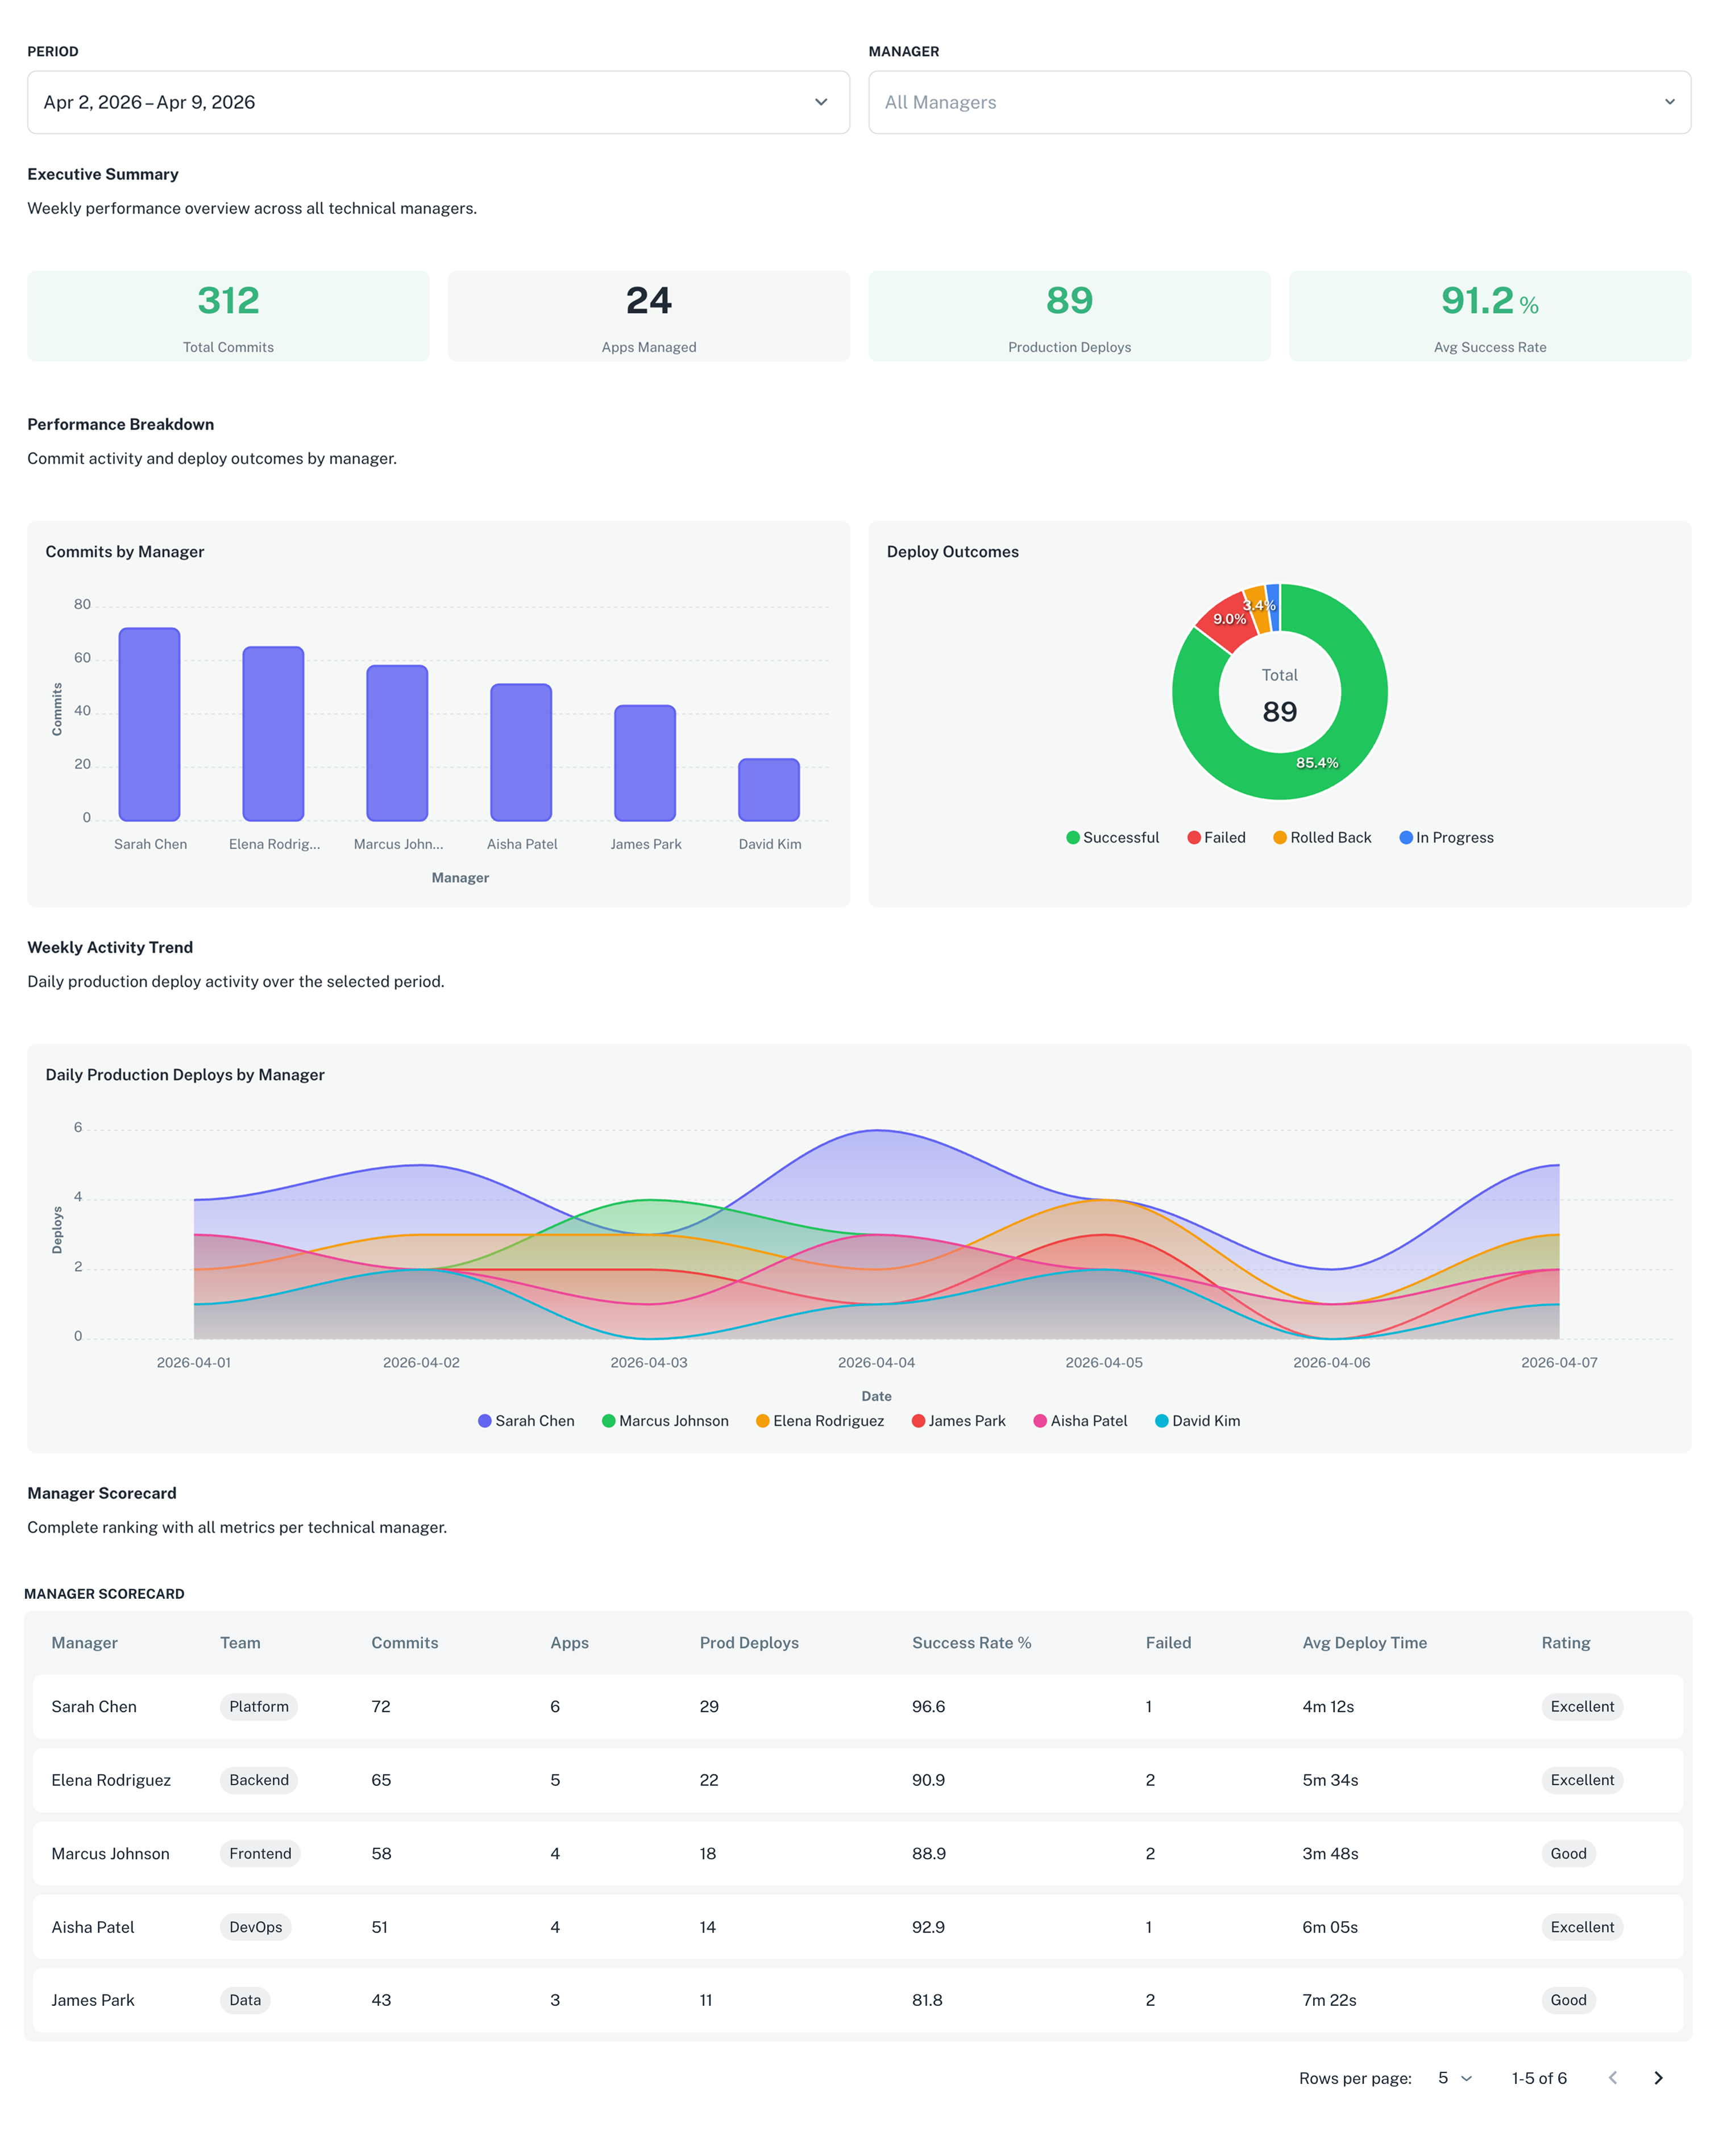
Get a per-manager view of engineering output: commits, applications worked on, production deployments, and success rates. Try *"Give me the weekly scorecard for each technical manager"*.
## Manager scorecards
Get a per-manager view of engineering output: commits, applications worked on, production deployments, and success rates. Try *"Give me the weekly scorecard for each technical manager"*.
 ## Deployment health
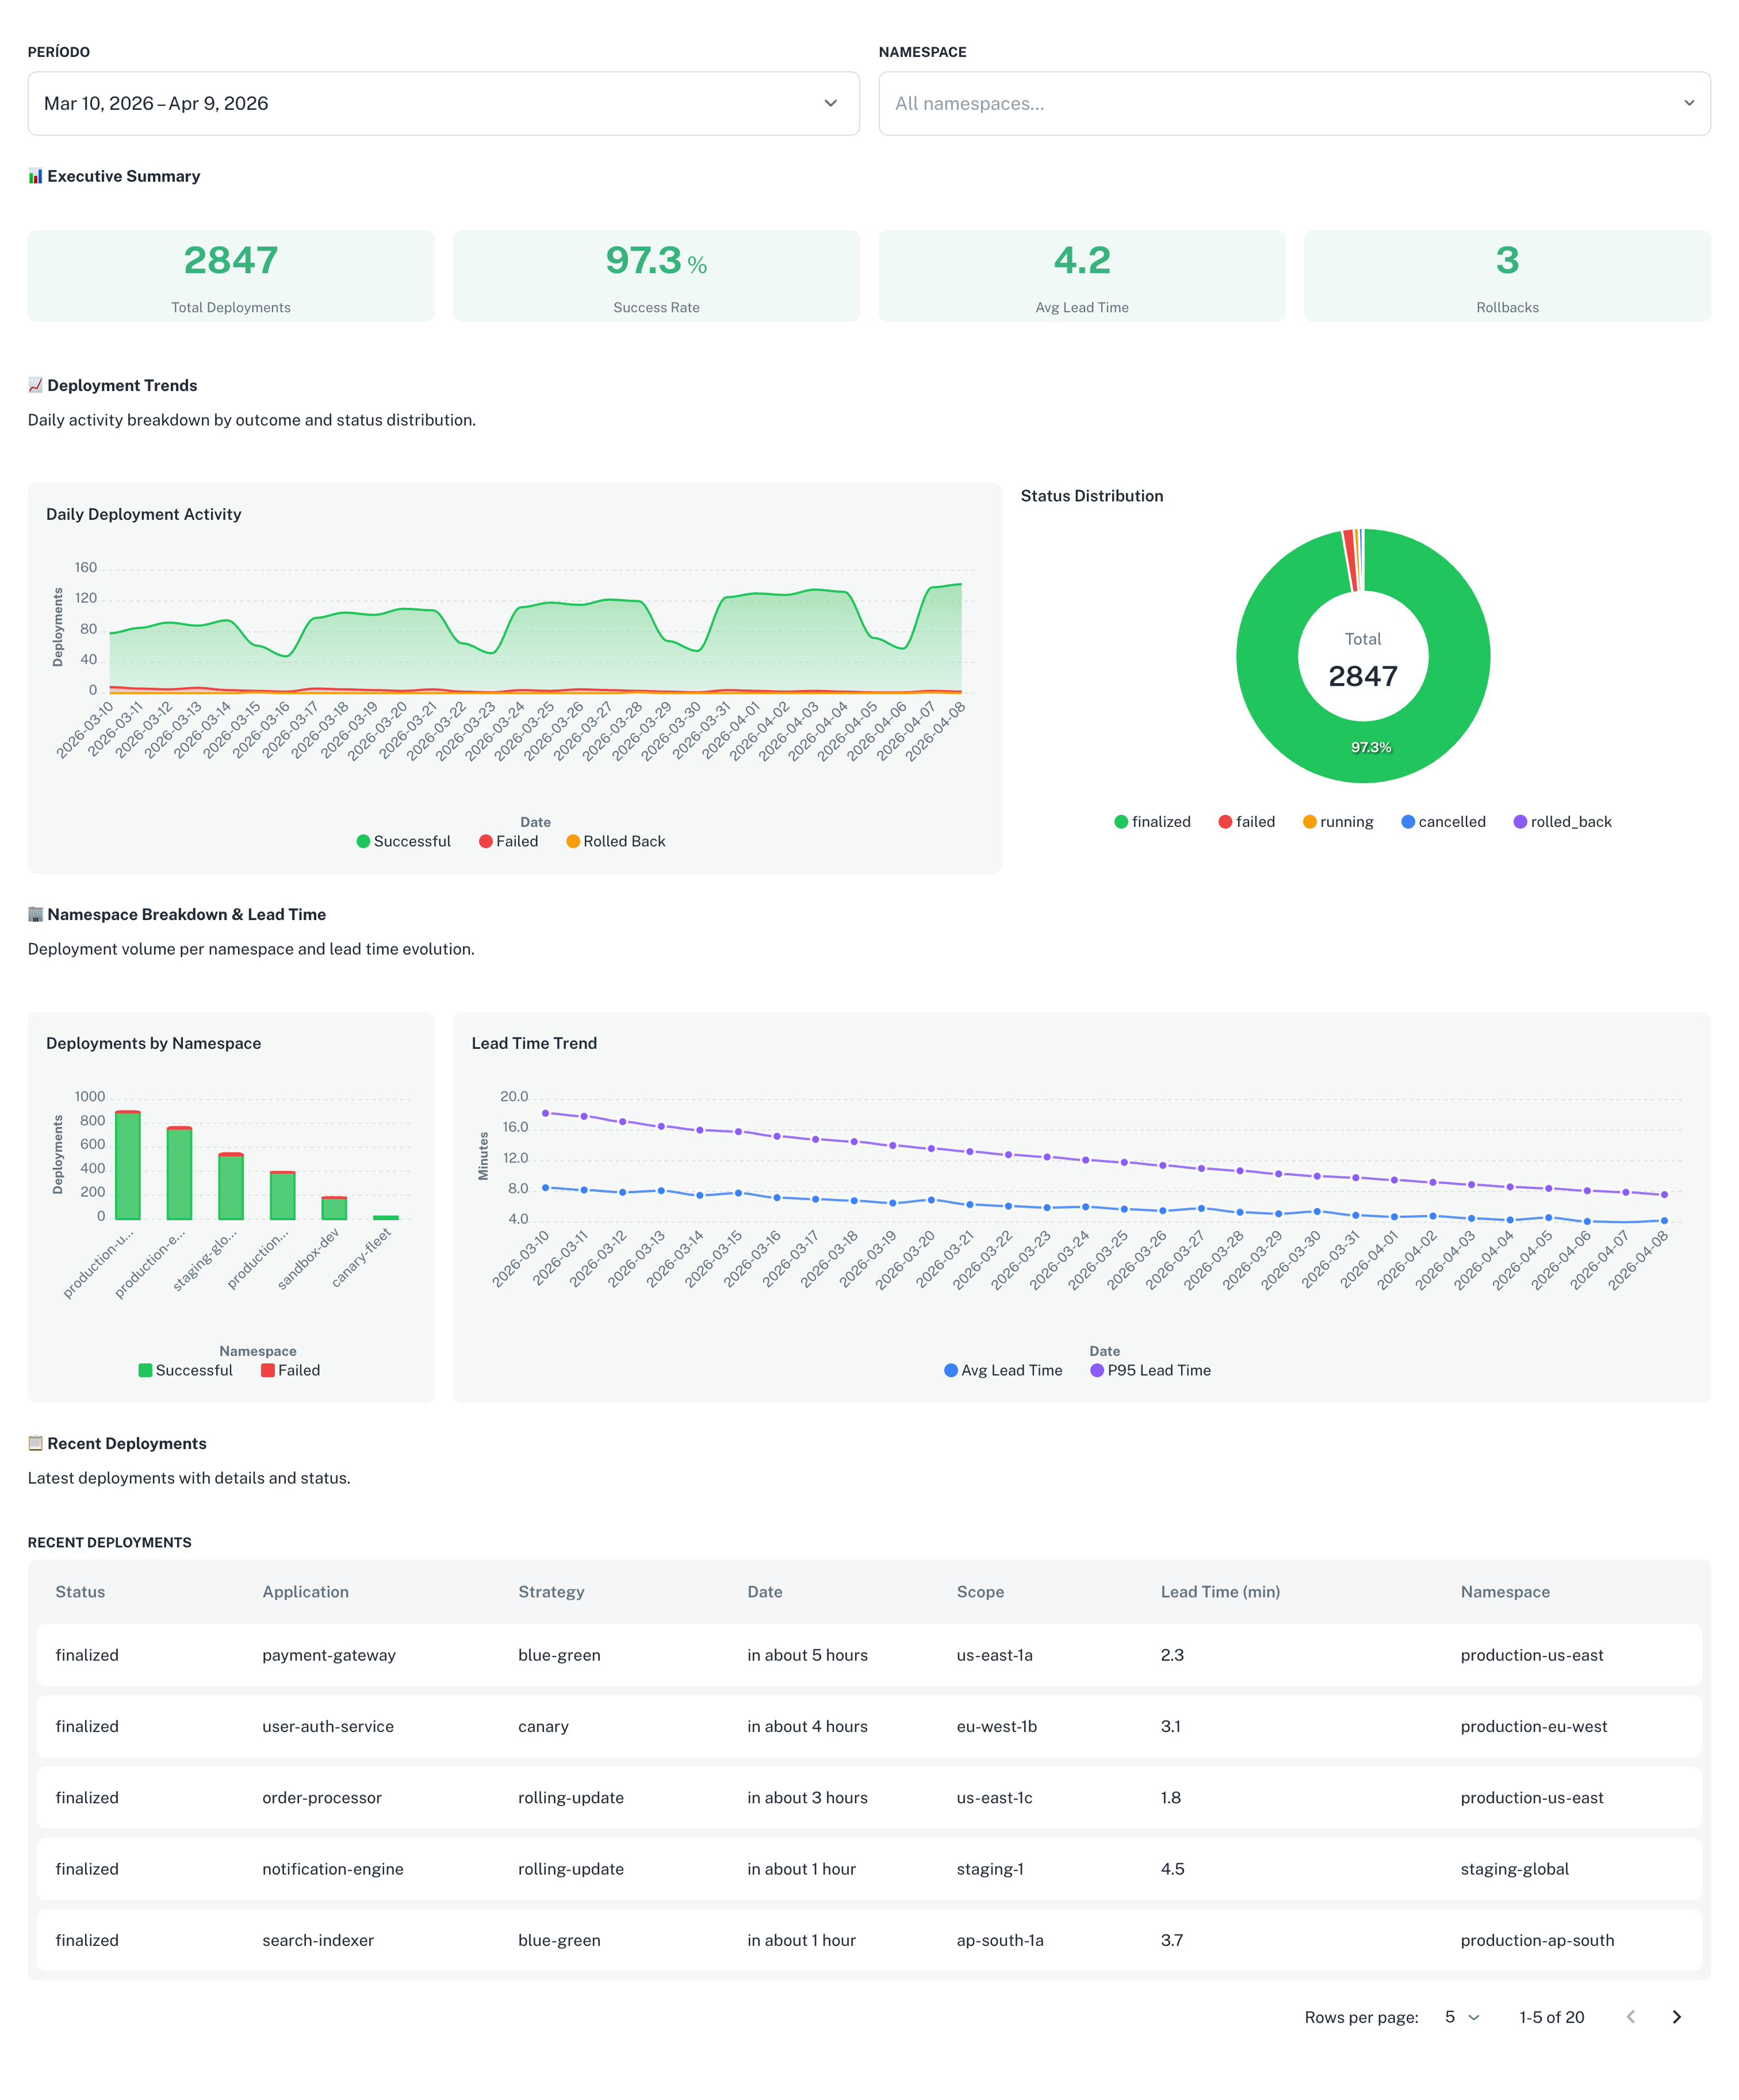
Monitor deployment frequency, success rates, rollbacks, and lead times across your organization. Try *"Show deployment success rate by namespace for the last 30 days"*.
## Deployment health
Monitor deployment frequency, success rates, rollbacks, and lead times across your organization. Try *"Show deployment success rate by namespace for the last 30 days"*.
 ## Cost and resource analysis
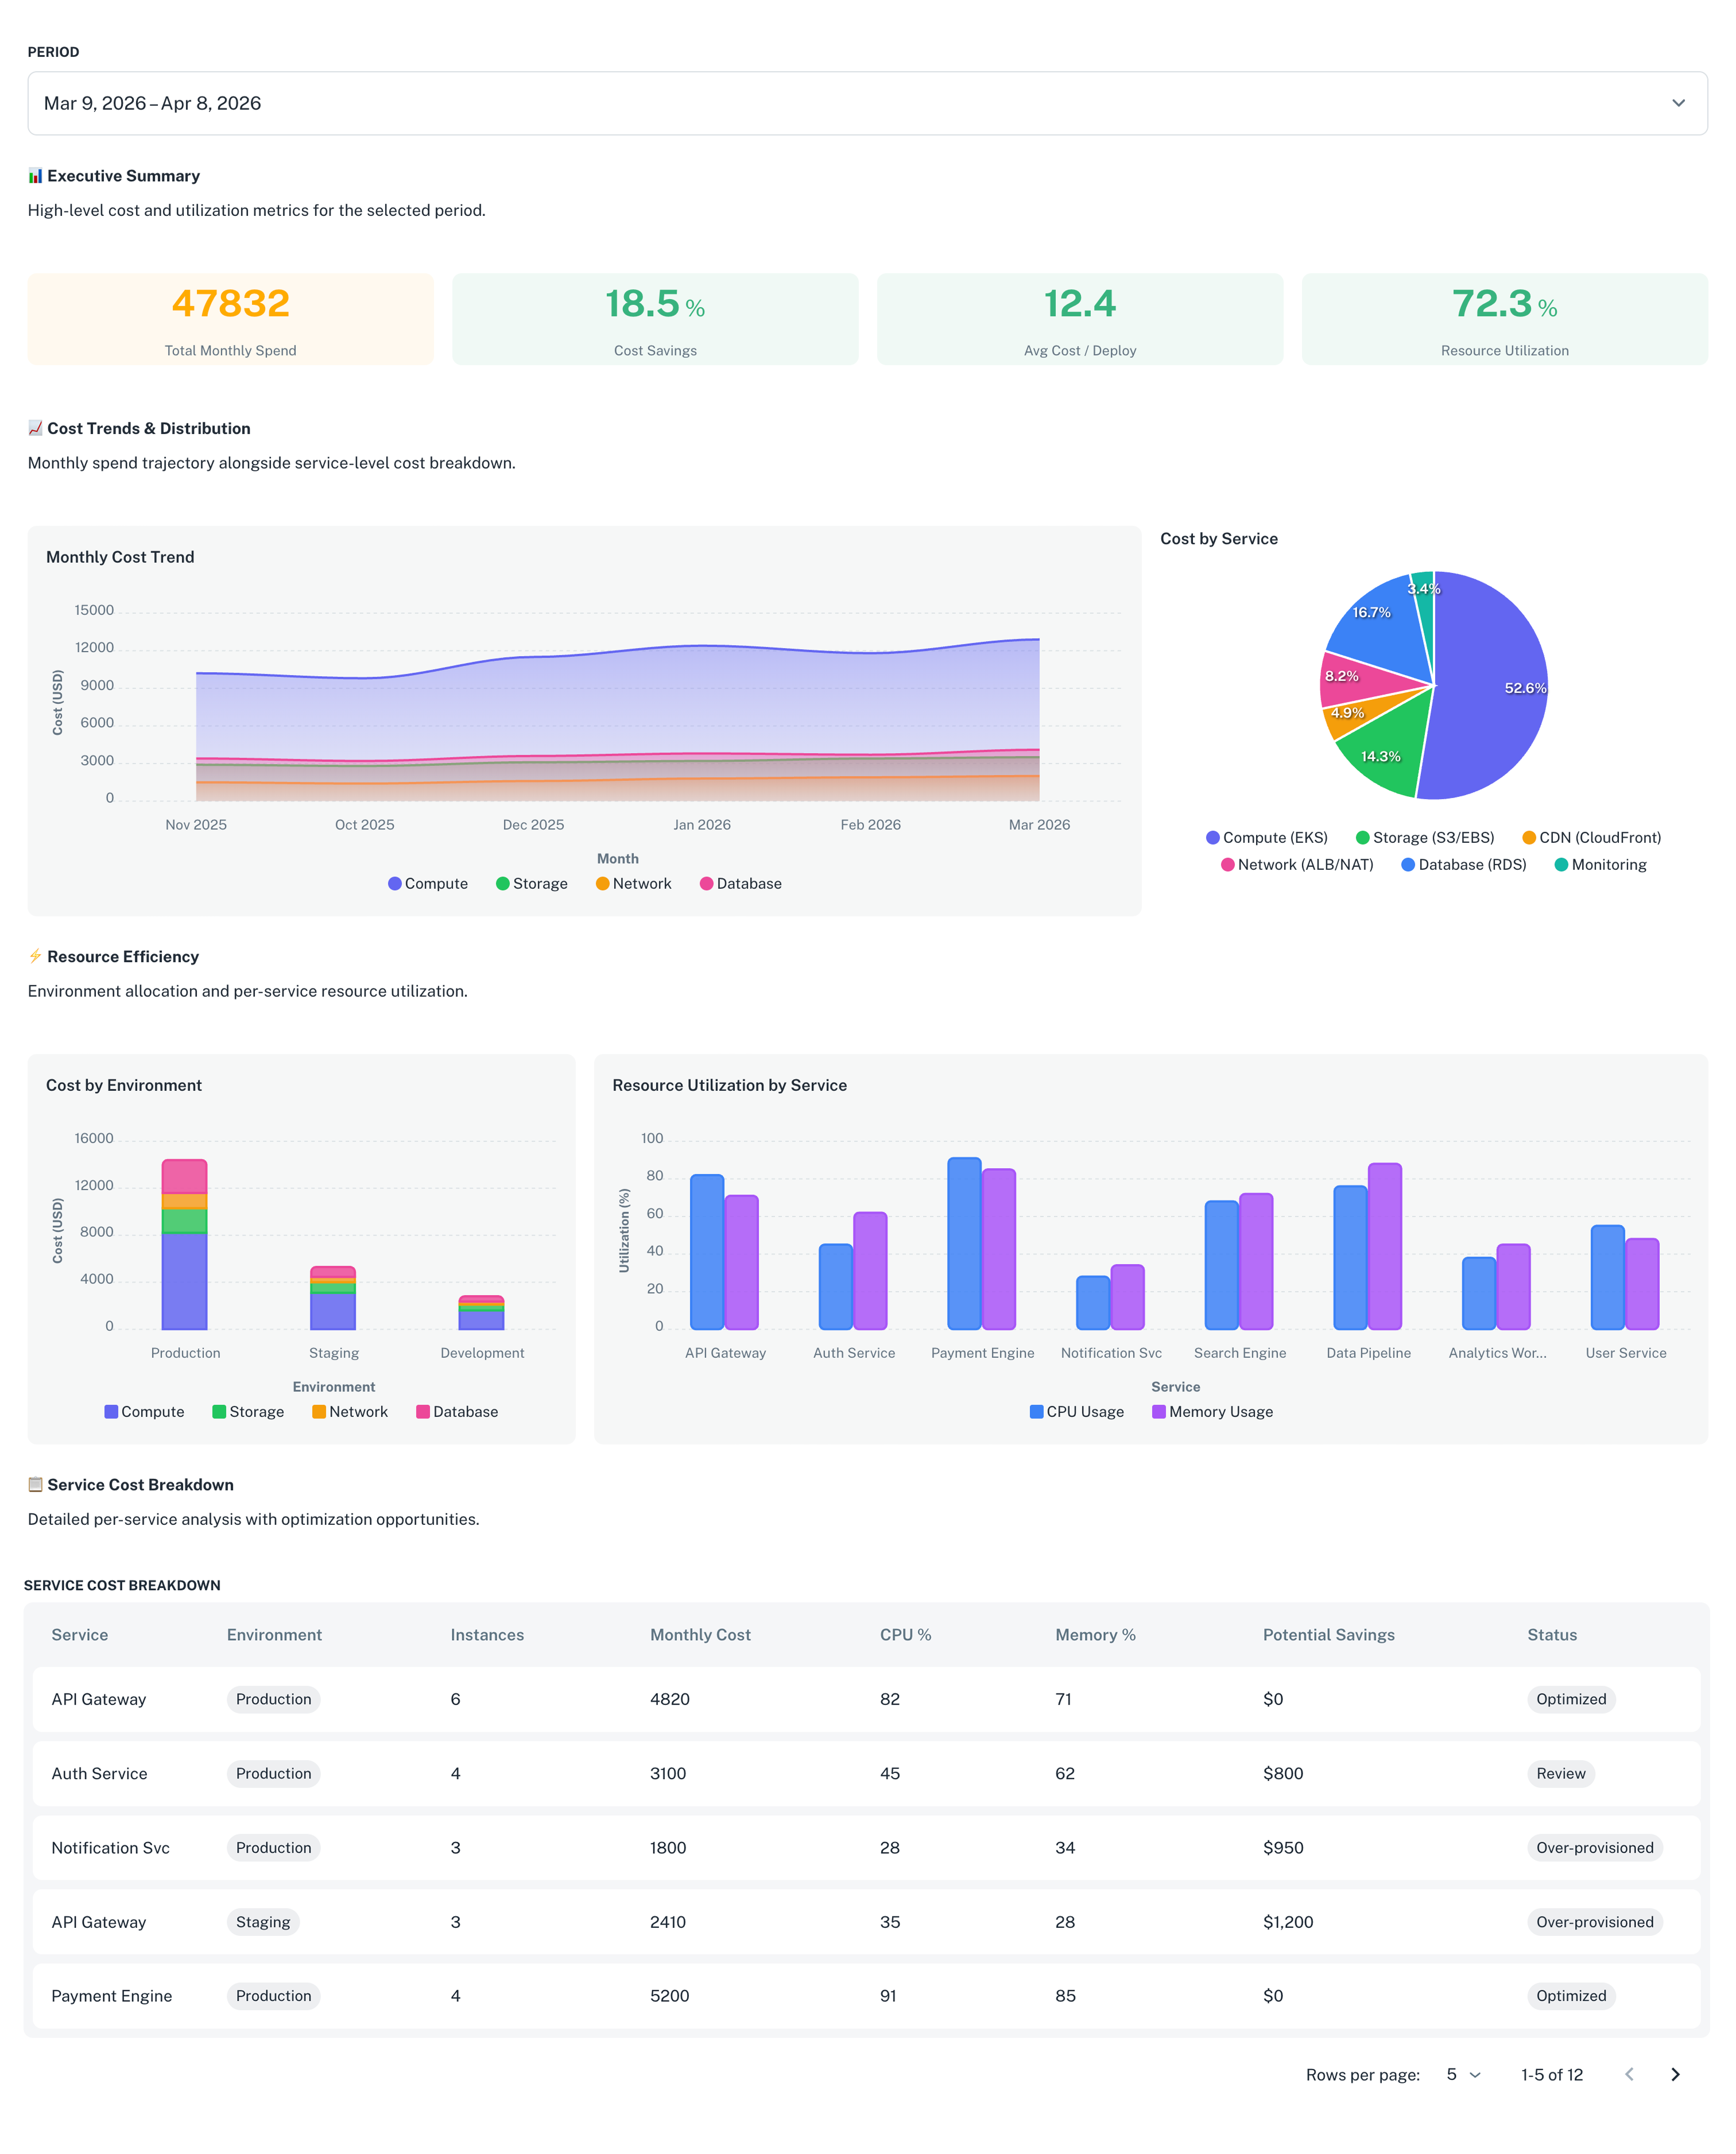
Understand where your infrastructure spend is going and where you can optimize. Try *"Show me applications that are over-provisioned"*.
## Cost and resource analysis
Understand where your infrastructure spend is going and where you can optimize. Try *"Show me applications that are over-provisioned"*.
 ## Security posture
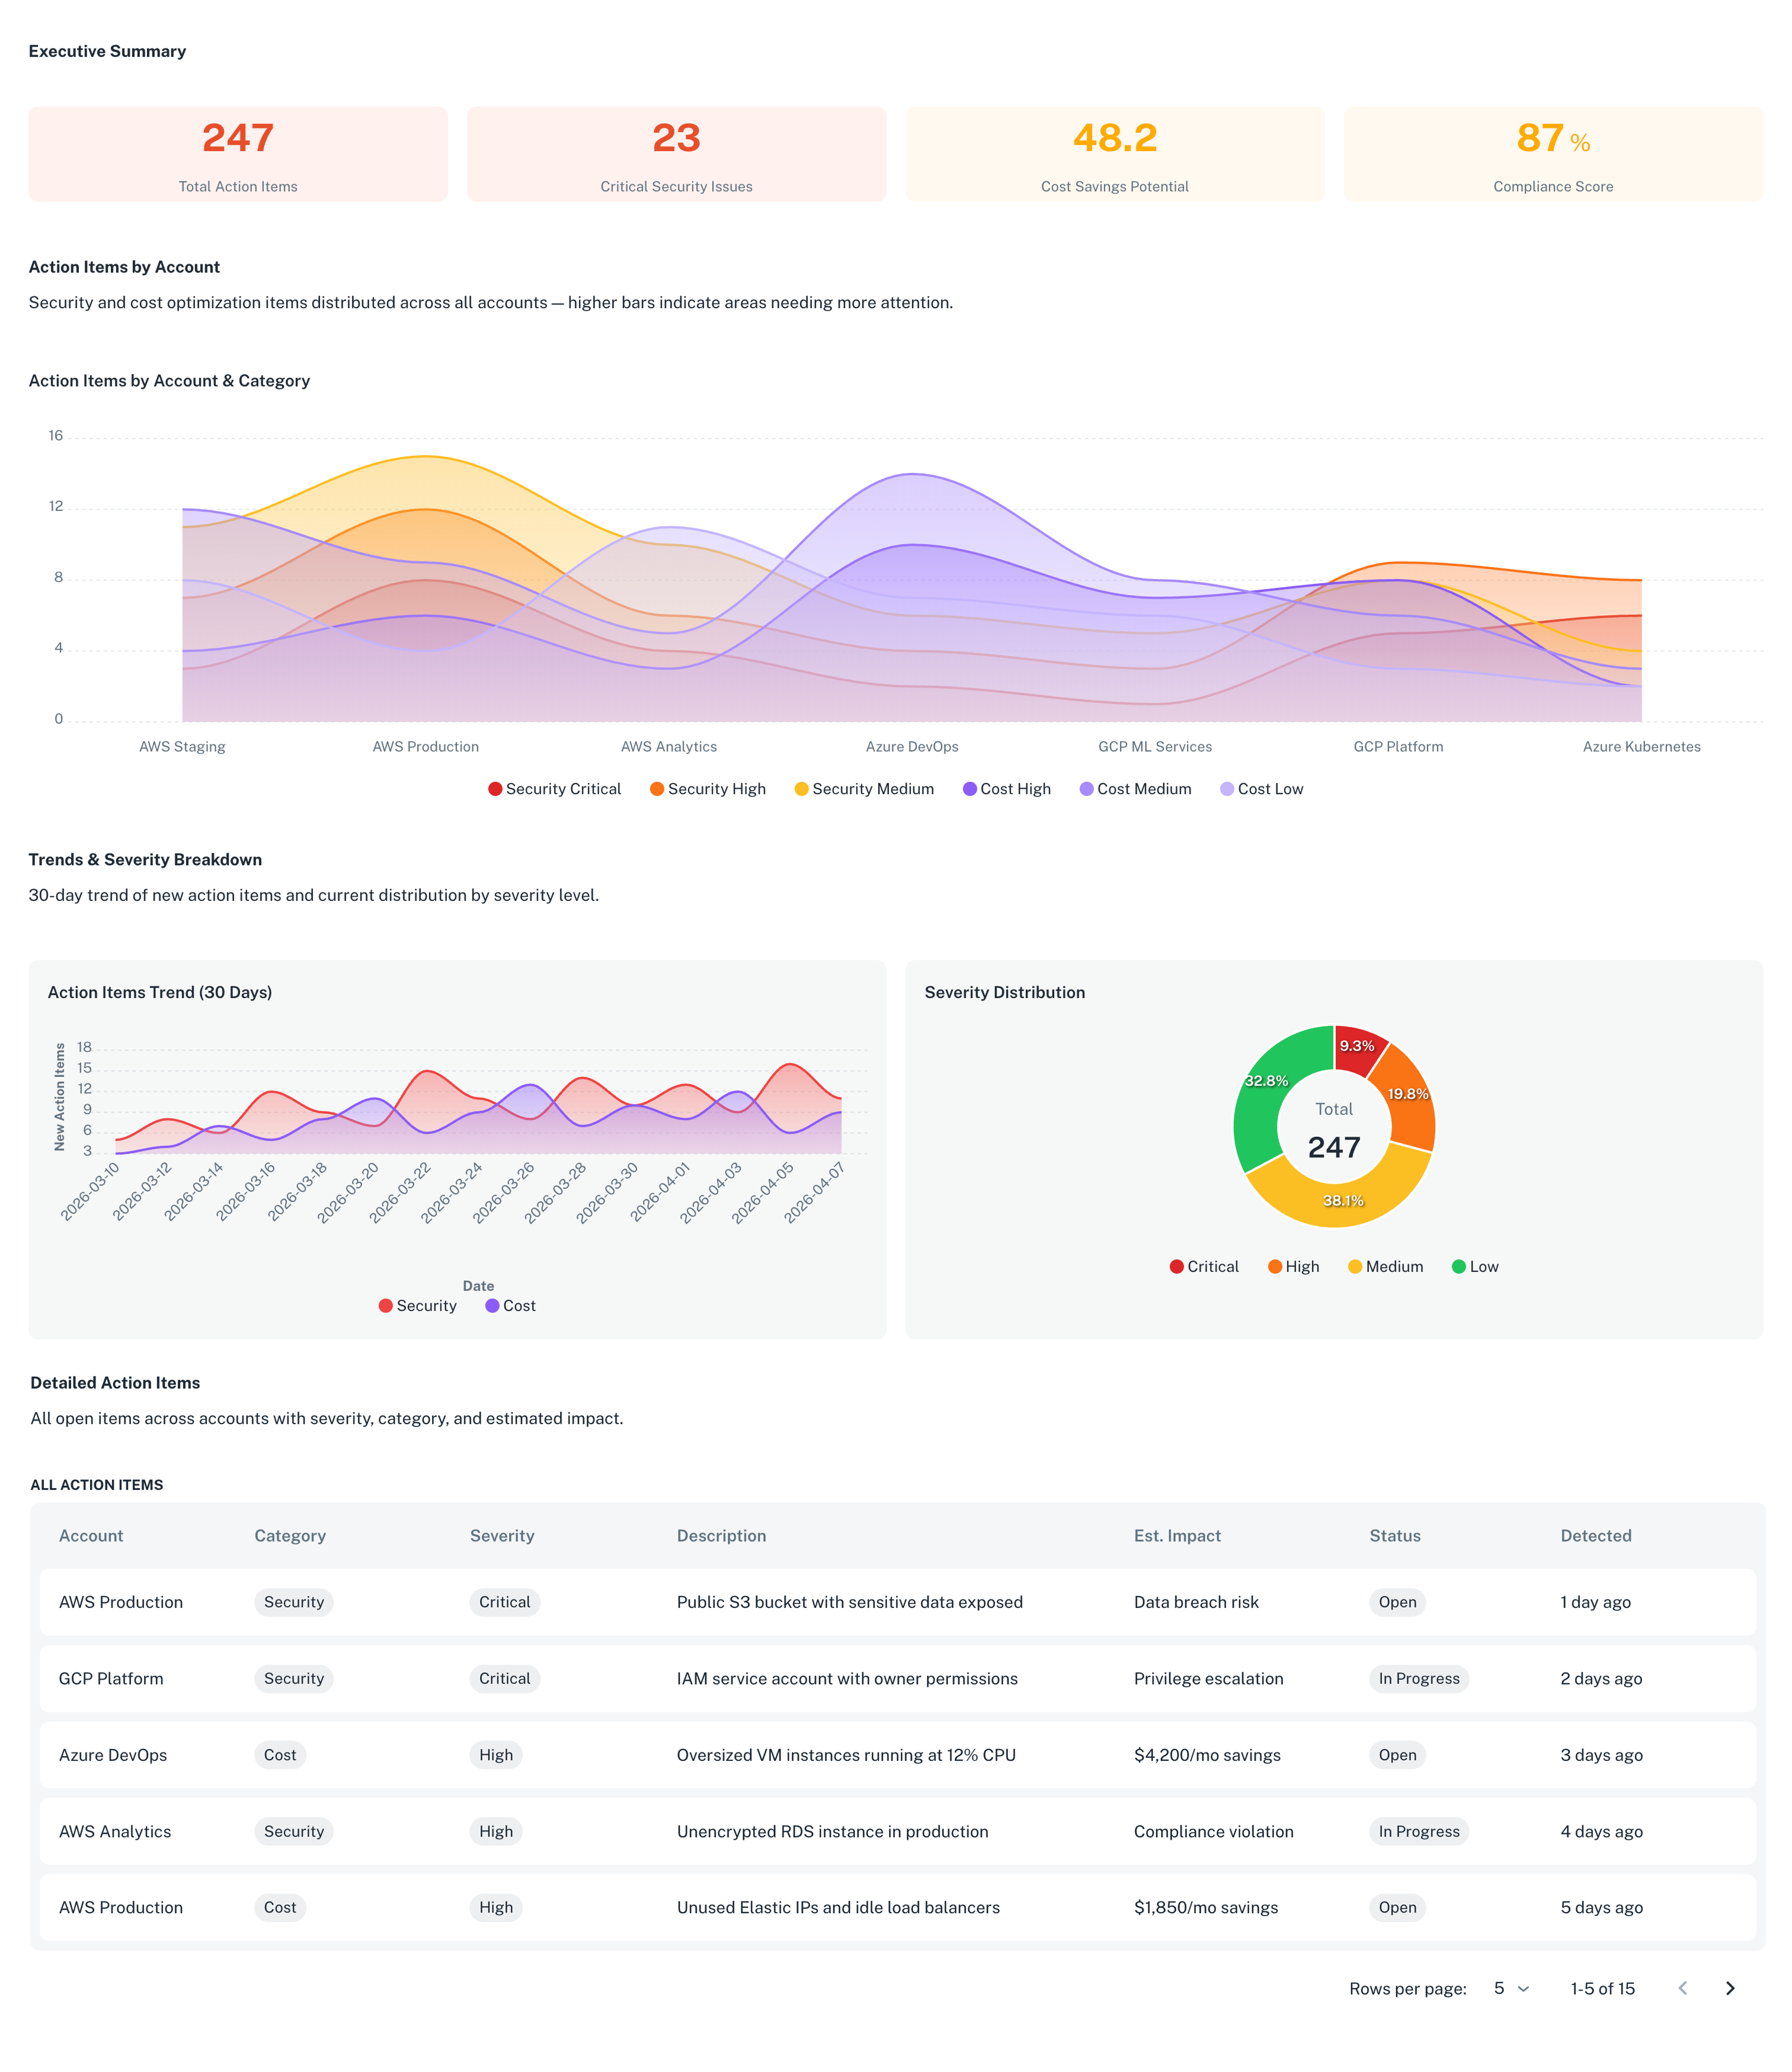
Track vulnerability status, scan coverage, and remediation velocity. Try *"Show a heatmap of security and cost action items across all accounts"*.
## Security posture
Track vulnerability status, scan coverage, and remediation velocity. Try *"Show a heatmap of security and cost action items across all accounts"*.
 If you're after something else, just ask. The assistant queries the same data that powers the nullplatform [Data Lake](/docs/data-lake/): deployments, builds, scopes, parameters, applications, action items, and more. If you need raw access or want to join nullplatform data with your own sources, the Data Lake lets you query it directly via SQL.
## Analyze a dashboard
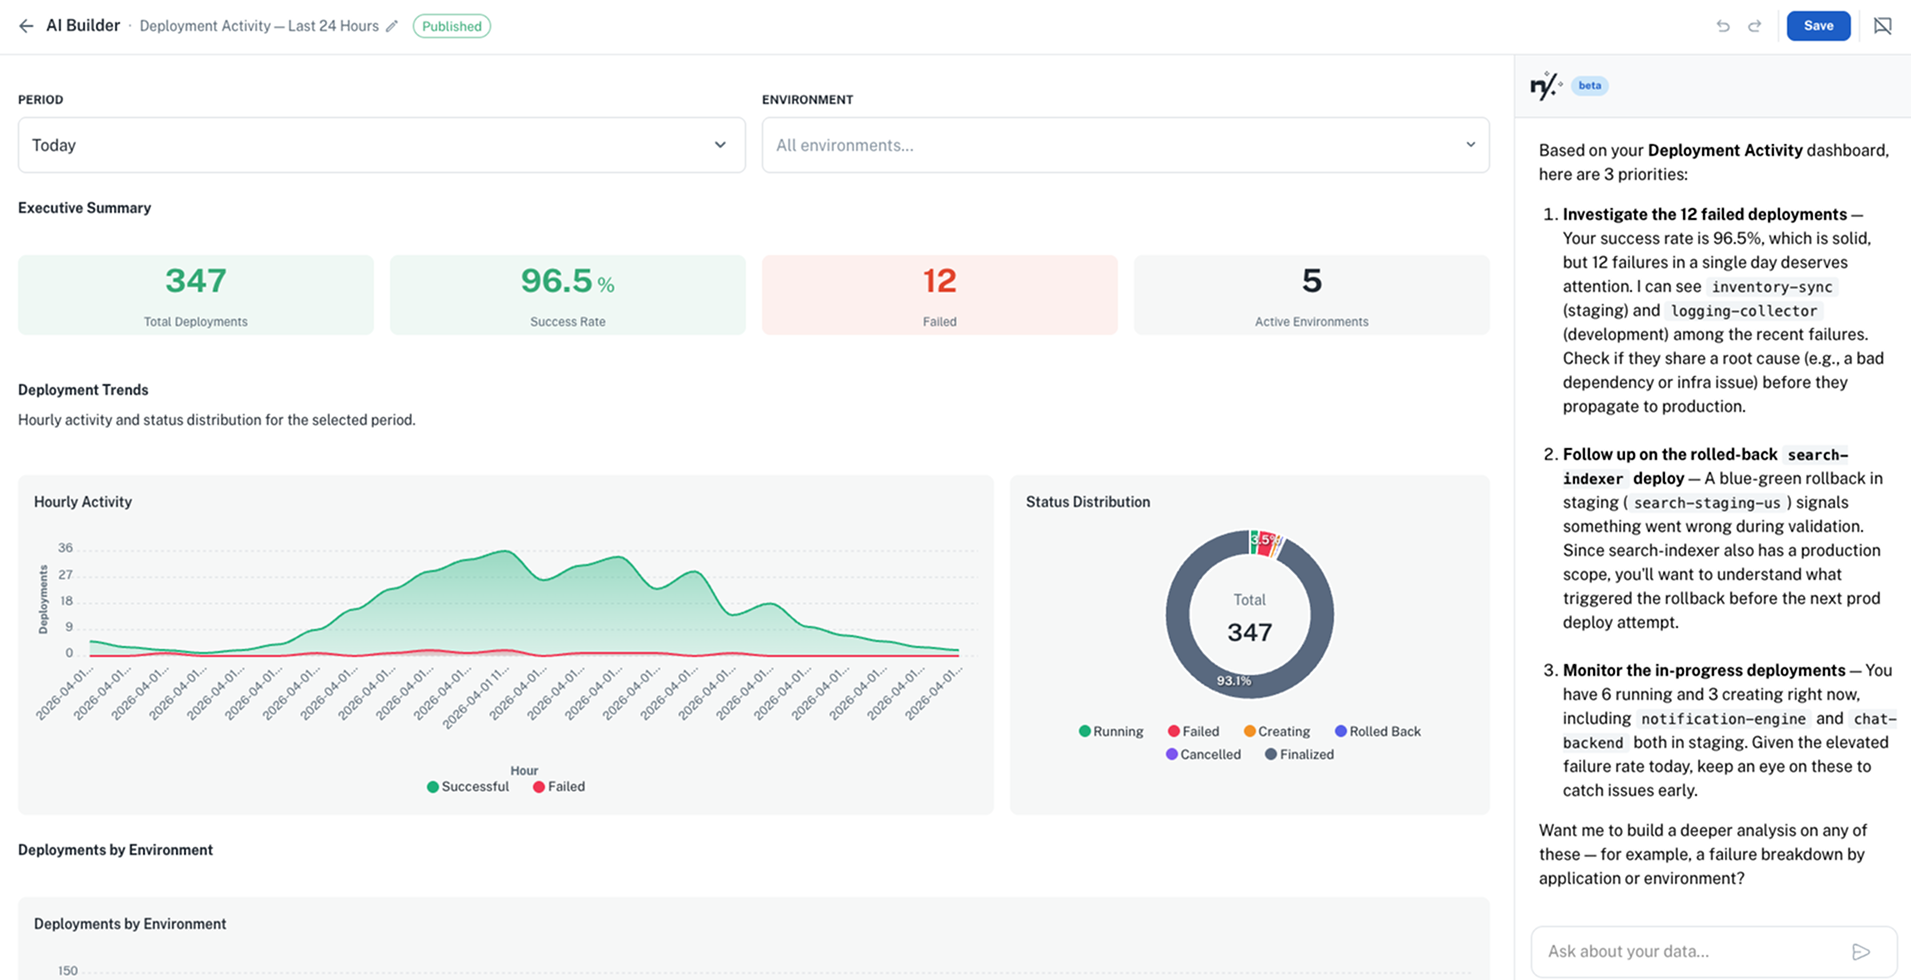
Any dashboard you own also works as a starting point for deeper analysis. Open it, click the **AI chat** icon, and ask about the data you see. The assistant reads every widget on the dashboard, always with live numbers rather than a snapshot from when it was created, and responds with conclusions and suggested next steps.
Ask it to summarize what matters (*"Give me a short list of the key things I should focus on right now, and why"*), flag anomalies (*"Anything unusual in the last 7 days?"*), compare (*"How does production compare to staging in terms of failures?"*), or recommend actions (*"What should we prioritize fixing based on this dashboard?"*).
If you're after something else, just ask. The assistant queries the same data that powers the nullplatform [Data Lake](/docs/data-lake/): deployments, builds, scopes, parameters, applications, action items, and more. If you need raw access or want to join nullplatform data with your own sources, the Data Lake lets you query it directly via SQL.
## Analyze a dashboard
Any dashboard you own also works as a starting point for deeper analysis. Open it, click the **AI chat** icon, and ask about the data you see. The assistant reads every widget on the dashboard, always with live numbers rather than a snapshot from when it was created, and responds with conclusions and suggested next steps.
Ask it to summarize what matters (*"Give me a short list of the key things I should focus on right now, and why"*), flag anomalies (*"Anything unusual in the last 7 days?"*), compare (*"How does production compare to staging in terms of failures?"*), or recommend actions (*"What should we prioritize fixing based on this dashboard?"*).
 :::note
The AI chat is only available on dashboards you own. Predefined dashboards and dashboards shared by other team members are view-only.
:::
## Tips for better results
- **Be specific about time ranges**: "last 7 days" and "this quarter" produce different dashboards
- **Reference entities by name**: "the payments namespace" or "checkout-service" gives the assistant precise context
- **Start broad, then refine**: ask "Show deployment activity this week", then follow up with "Break that down by team"
## From question to shared dashboard
Every dashboard you create here can be [saved, published, and shared](./dashboard-builder.md#saving-and-publishing) with your organization. A question you ask once can become a recurring dashboard that your entire leadership team accesses from the Insights sidebar.
:::note
The AI chat is only available on dashboards you own. Predefined dashboards and dashboards shared by other team members are view-only.
:::
## Tips for better results
- **Be specific about time ranges**: "last 7 days" and "this quarter" produce different dashboards
- **Reference entities by name**: "the payments namespace" or "checkout-service" gives the assistant precise context
- **Start broad, then refine**: ask "Show deployment activity this week", then follow up with "Break that down by team"
## From question to shared dashboard
Every dashboard you create here can be [saved, published, and shared](./dashboard-builder.md#saving-and-publishing) with your organization. A question you ask once can become a recurring dashboard that your entire leadership team accesses from the Insights sidebar.