---
sidebar_label: "Scopes: logs and metrics"
doc_id: f7c2a3e9-6b4d-4f91-9b8a-2a6d0e3c7c52
description: >-
Configure custom log and metric providers for agent-backed scopes using the nullplatform agent.
keywords:
- observability
- logs
- metrics
- telemetry
- agent
- scopes
---
import Tabs from '@theme/Tabs';
import TabItem from '@theme/TabItem';
# Configure a custom telemetry provider for scopes
Extend nullplatform's observability by **implementing custom log and metric providers** for agent-backed scopes. This guide shows how to configure
your provider and channel for any backend, so logs and performance metrics appear in the UI.
## When to use this
Use a custom telemetry provider if nullplatform doesn't support your product (for example, Grafana) or if telemetry
only exists in a private environment that nullplatform can't reach (for example, an Elasticsearch instance in your
infrastructure).
To do this, you'll use [the nullplatform agent](/docs/agent/overview), which lets you:
1. Implement and **run your own scripts to collect logs and metrics** from any provider.
2. Keep those providers private, because **the agent runs in your infrastructure** and can access them **without exposing
them externally**.
## Prerequisites
You'll need the following before configuring a custom telemetry provider:
- The [nullplatform agent](/docs/agent/installation) installed and configured.
- An [API key](/docs/authorization/api-keys) with the necessary permissions: **agent**, **developer**, and **ops**.
## Configure a custom telemetry provider
To use a custom telemetry provider with nullplatform, you need to configure two things:
1. **The telemetry provider** for the scope types you want.
2. **A telemetry notification channel** to tell nullplatform where and how to reach your provider.
### 1. Configure the telemetry provider for a scope type
In nullplatform, you can deploy different application types called `scope types`. Each scope type can use a different
metrics provider.
When using your own provider, configure the platform so that metrics and logs come from an *external* provider for
each scope type that should use it.
You can do this as follows:
```bash
np nrn patch \
--nrn "organization=1:account=2:namespace=3:application=4" \
--body "{
\"global.${SCOPE_TYPE_SLUG}_metric_provider\": \"externalmetrics\",
\"global.${SCOPE_TYPE_SLUG}_log_provider\": \"external\"
}"
```
```bash
curl -X PATCH 'https://api.nullplatform.com/nrn/organization=1:account=2:namespace=3:application=4' \
-H 'Content-Type: application/json' \
-H 'Accept: application/json' \
-H 'Authorization: Bearer ' \
-d '{
\"global.${SCOPE_TYPE_SLUG}_metric_provider\": \"externalmetrics\",
\"global.${SCOPE_TYPE_SLUG}_log_provider\": \"external\"
}'
```
#### Example configuration
For example, if you use the nullplatform "Containers" scope, the configuration looks like this:
```bash
np nrn patch \
--nrn "organization=1:account=2:namespace=3:application=4" \
--body "{
\"global.containers_metric_provider\": \"externalmetrics\",
\"global.containers_log_provider\": \"external\"
}"
```
```bash
curl -X PATCH 'https://api.nullplatform.com/nrn/organization=1:account=2:namespace=3:application=4' \
-H 'Content-Type: application/json' \
-H 'Accept: application/json' \
-H 'Authorization: Bearer ' \
-d '{
\"global.containers_metric_provider\": \"externalmetrics\",
\"global.containers_log_provider\": \"external\"
}'
```
### 2. Configure the channel
Once you tell nullplatform that metrics and logs come from your provider, you also need to create a channel to tell
nullplatform where and how to reach your provider.
This notification channel will:
- Consume "telemetry" notifications.
- Use the nullplatform agent as the execution runtime.
- Execute a script that points to your implementation.
Go to **Platform settings > Notifications > Channels** and click **+ New channel**.
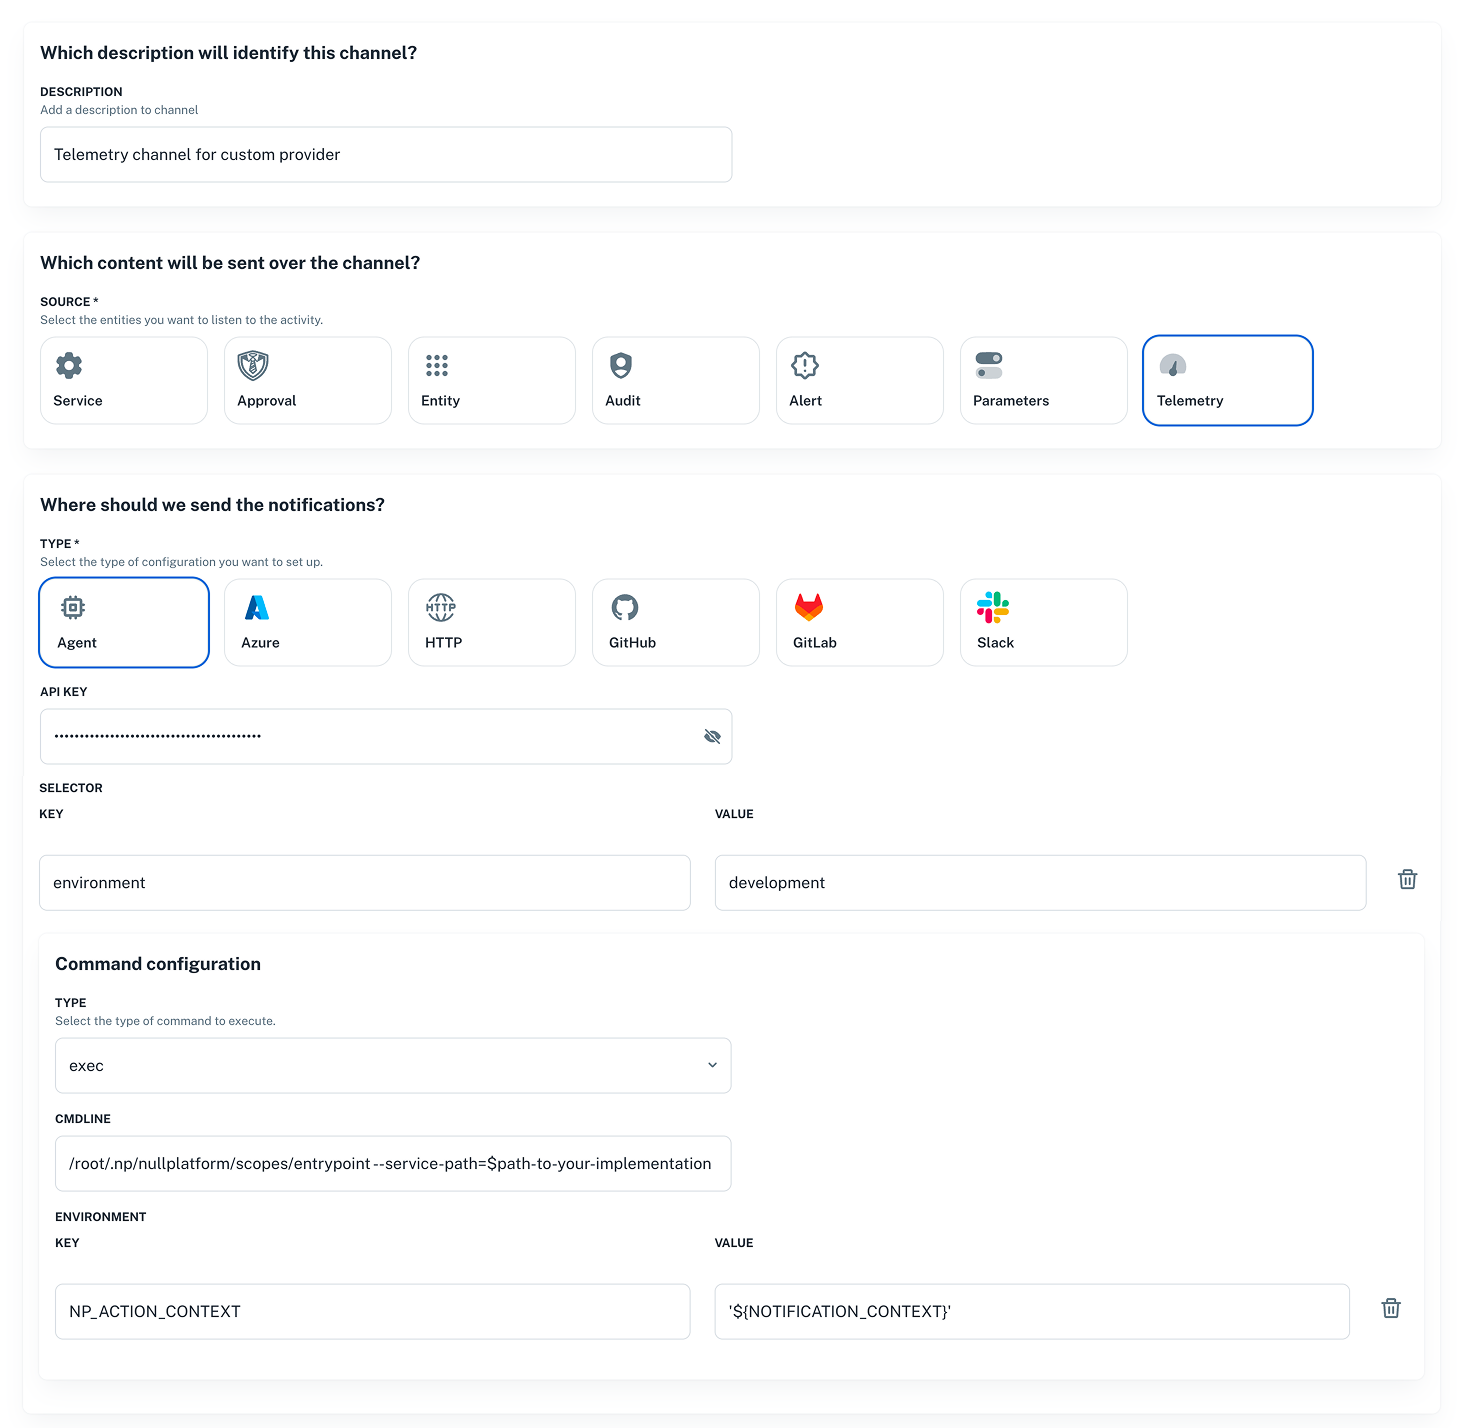 Send a POST request to the [Notification channel endpoint](https://api.nullplatform.com/notification/channel) with a body like the following:
```bash
curl -X POST 'https://api.nullplatform.com/notification/channel' \
-H 'Content-Type: application/json' \
-H 'Accept: application/json' \
-H 'Authorization: Bearer ' \
-d '{
"nrn": "organization=1:account=2:namespace=3:application=4",
"description": "Telemetry channel for custom provider",
"source": [
"telemetry"
],
"type": "agent",
"configuration": {
"api_key": "AAAA.1234567890abcdef1234567890abcdefPTs=",
"command": {
"data": {
"cmdline": "/root/.np/nullplatform/scopes/entrypoint --service-path=$path-to-your-implementation",
"environment": {
"NP_ACTION_CONTEXT": "'${NOTIFICATION_CONTEXT}'"
}
},
"type": "exec"
},
"selector": {
"environment": "development" // this selectors must match the agent tags.
}
},
"filters": {
"arguments.scope_provider": {
"$eq": "$scope-type-id"
}
}
}'
```
Send a POST request using the CLI. See [Notification channel endpoint](https://api.nullplatform.com/notification/channel) for more details.
```bash
np notification channel create \
--body '{
"nrn": "organization=1:account=2:namespace=3:application=4",
"description": "Telemetry channel for custom provider",
"source": [
"telemetry"
],
"type": "agent",
"configuration": {
"api_key": "AAAA.1234567890abcdef1234567890abcdefPTs=",
"command": {
"data": {
"cmdline": "/root/.np/nullplatform/scopes/entrypoint --service-path=$path-to-your-implementation",
"environment": {
"NP_ACTION_CONTEXT": "'${NOTIFICATION_CONTEXT}'"
}
},
"type": "exec"
},
"selector": {
"environment": "development" // this selectors must match the agent tags.
}
},
"filters": {
"arguments.scope_provider": {
"$eq": "$scope-type-id"
}
}
}'
```
:::note
The **selectors** you define here **must match the tags assigned to your agent**.
:::
#### Example command configuration
Suppose your GitHub organization is `acme-corp` and you have a repo named `telemetry` that implements a
provider named `grafana`. In that case, the script you configure in the channel would be:
```bash
/root/.np/nullplatform/scopes/entrypoint --service-path=/root/.np/acme-corp/telemetry/grafana
```
## Required implementations for logs or metrics
You can implement **logs, metrics, or both**. Use the operations below based on what you need.
## Logs
To **implement a logs provider**, define the following operations.
| Operation | Purpose | Workflow Path |
|-------------------|---------|---------------|
| [Read logs](#read-logs) | Retrieve application logs | `log/workflows/log.yaml` |
### Read logs
Retrieves application logs from your logging backend. This enables log viewing within the nullplatform UI.
#### Workflow path
```
/log/workflows/log.yaml
```
#### Input
The following JSON is provided via the `NP_ACTION_CONTEXT` environment variable:
```json
{
"action": "log:read",
"entity_nrn": "organization=1:account=2:namespace=3:application=4:scope=5",
"arguments": {
"log_type": "application",
"application_id": "4",
"scope_id": "5",
"limit": 100,
"start_time": 1769019098258,
"end_time": 1769018602617,
"scope_type": "custom",
"scope_provider": "$scope-type-uuid"
},
"scope": {
"id": 5,
"slug": "my-scope",
"name": "my-scope",
"type": "custom",
"nrn": "organization=1:account=2:namespace=3:application=4:scope=5",
"provider": "$scope-type-uuid",
"profiles": [
"environment_development",
"country_argentina"
]
},
"service": {
"id": "9a4c1f2e-7b8d-4f6a-9c3e-1d2b8e5a6f40",
"dimensions": {
"environment": "development",
"country": "argentina"
}
},
"parameters": {
"scope_id": 5
},
"tags": {
"organization_id": "1",
"organization": "acme-corp",
"account_id": "2",
"account": "main",
"namespace_id": "3",
"namespace": "acme-namespace",
"application_id": "4",
"application": "acme-services-action-app",
"scope_id": "5",
"scope": "my-scope"
}
}
```
#### Response format
Your script must output a JSON object to `stdout` with the following structure:
```json
{
"results": [
{
"datetime": "2024-01-15T10:30:00.000Z",
"message": "Application started successfully"
},
{
"timestamp": "2024-01-15T10:30:01.500Z",
"message": "Connected to database"
}
],
"next_page_token": "eyJwYdlIMDAsInQiOR9="
}
```
| Field | Type | Required | Description |
|-------|------|----------|-------------|
| `results` | array | Yes | Array of log entries |
| `results[].timestamp` | string | Yes | ISO 8601 formatted timestamp |
| `results[].message` | string | Yes | Log message content |
| `next_page_token` | string | No | Token for pagination; omit if no more results |
## Metrics
To **implement a metrics provider**, define the following operations.
| Operation | Purpose | Workflow Path |
|----------------------------------------|---------|---------------|
| [List available metrics](#list-available-metrics) | Enumerate available metrics | `metric/workflows/list.yaml` |
| [Read metric](#read-metric) | Fetch time-series metrics | `metric/workflows/metric.yaml` |
| [List instances](#list-instances) | List running instances for a scope | `instance/workflows/list.yaml` |
### List available metrics
Lists the metrics available from your backend for discovery in the nullplatform UI.
#### Workflow path
```
/metric/workflows/list.yaml
```
#### Input
The following JSON is provided via the `NP_ACTION_CONTEXT` environment variable:
```json
{
"action": "metric:list",
"entity_nrn": "organization=1:account=2:namespace=3:application=4:scope=5",
"arguments": {
"application_id": "4",
"scope_type": "custom",
"scope_provider": "$scope-type-uuid"
},
"scope": {
"id": 5,
"slug": "my-scope",
"name": "my-scope",
"type": "custom",
"nrn": "organization=1:account=2:namespace=3:application=4:scope=5",
"provider": "$scope-type-uuid",
"profiles": [
"environment_development",
"country_argentina"
]
},
"service": {
"id": "9a4c1f2e-7b8d-4f6a-9c3e-1d2b8e5a6f40",
"dimensions": {
"environment": "development",
"country": "argentina"
}
},
"parameters": {
"scope_id": 5
},
"tags": {
"organization_id": "1",
"organization": "acme-corp",
"account_id": "2",
"account": "main",
"namespace_id": "3",
"namespace": "acme-namespace",
"application_id": "4",
"application": "acme-services-action-app",
"scope_id": "5",
"scope": "my-scope"
}
}
```
#### Response format
```json
{
"results": [
{
"name": "http.rpm",
"title": "Throughput",
"unit": "rpm",
"available_filters": ["scope_id", "instance_id"],
"available_group_by": ["instance_id"]
},
{
"name": "http.response_time",
"title": "Response Time",
"unit": "ms",
"available_filters": ["scope_id", "instance_id"],
"available_group_by": ["instance_id"]
},
{
"name": "http.error_rate",
"title": "Error Rate",
"unit": "%",
"available_filters": ["scope_id", "instance_id"],
"available_group_by": ["instance_id"]
},
{
"name": "system.cpu_usage_percentage",
"title": "CPU Usage",
"unit": "%",
"available_filters": ["scope_id", "instance_id"],
"available_group_by": ["instance_id"]
},
{
"name": "system.memory_usage_percentage",
"title": "Memory Usage",
"unit": "%",
"available_filters": ["scope_id", "instance_id"],
"available_group_by": ["scope_id", "instance_id"]
}
]
}
```
| Field | Type | Required | Description |
|-------|------|----------|-------------|
| `results` | array | Yes | Array of available metrics |
| `results[].name` | string | Yes | Metric identifier used in API calls |
| `results[].title` | string | Yes | Human-readable display name |
| `results[].unit` | string | Yes | Unit of measurement for display |
| `results[].available_filters` | array | Yes | Supported filter dimensions |
| `results[].available_group_by` | array | Yes | Supported grouping dimensions |
### Read metric
Fetches time-series metric data for visualization and alerting in nullplatform.
#### Workflow path
```
/metric/workflows/metric.yaml
```
#### Input
The following JSON is provided via the `NP_ACTION_CONTEXT` environment variable:
```json
{
"action": "metric:data",
"entity_nrn": "organization=1:account=2:namespace=3:application=4:scope=5",
"arguments": {
"metric": "http.error_rate",
"start_time": "2026-01-21T18:26:49.689Z",
"end_time": "2026-01-21T18:56:49.689Z",
"filters": {
"scope": "my-scope"
},
"period": 60,
"group_by": [],
"application_id": 4,
"scope_id": "5",
"options": {},
"scope_type": "custom",
"scope_provider": "$scope-type-uuid"
},
"scope": {
"id": 5,
"slug": "my-scope",
"name": "my-scope",
"type": "custom",
"nrn": "organization=1:account=2:namespace=3:application=4:scope=5",
"provider": "$scope-type-uuid",
"profiles": [
"environment_development",
"country_argentina"
]
},
"service": {
"id": "9a4c1f2e-7b8d-4f6a-9c3e-1d2b8e5a6f40",
"dimensions": {
"environment": "development",
"country": "argentina"
}
},
"parameters": {
"scope_id": 5
},
"tags": {
"organization_id": "1",
"organization": "acme-corp",
"account_id": "2",
"account": "main",
"namespace_id": "3",
"namespace": "acme-namespace",
"application_id": "4",
"application": "acme-services-action-app",
"scope_id": "5",
"scope": "my-scope"
}
}
```
#### Supported metric names
The supported metric names are the ones you defined in your metric list implementation.
#### Response format
```json
{
"metric": "http.rpm",
"type": "gauge",
"period_in_seconds": 60,
"unit": "count_per_minute",
"results": [
{
"selector": {
"scope_id": "456",
"instance_id": "pod-abc123"
},
"data": [
{
"timestamp": "2024-01-15T10:00:00Z",
"value": 1250.5
},
{
"timestamp": "2024-01-15T10:01:00Z",
"value": 1340.2
}
]
}
]
}
```
| Field | Type | Required | Description |
|-------|------|----------|-------------|
| `metric` | string | Yes | The metric name |
| `type` | string | Yes | Metric type (`gauge`, `counter`) |
| `period_in_seconds` | number | Yes | Data point aggregation period |
| `unit` | string | Yes | Unit of measurement |
| `results` | array | Yes | Array of time series |
| `results[].selector` | object | Yes | Labels identifying the series |
| `results[].data` | array | Yes | Array of data points |
| `results[].data[].timestamp` | string | Yes | ISO 8601 timestamp |
| `results[].data[].value` | number | Yes | Metric value |
### List instances
Lists running instances (pods, containers, VMs) for a scope so you can filter metrics per instance in nullplatform.
#### Workflow path
```
/instance/workflows/list.yaml
```
#### Input
The following JSON is provided via the `NP_ACTION_CONTEXT` environment variable:
```json
{
"action": "instance:data",
"entity_nrn": "organization=1:account=2:namespace=3:application=4:scope=5",
"arguments": {
"application_id": [
"4"
],
"scope_id": [
"5"
],
"scope_type": "custom",
"scope_provider": "$scope-type-uuid"
},
"scope": {
"id": 5,
"slug": "my-scope",
"name": "my-scope",
"type": "custom",
"nrn": "organization=1:account=2:namespace=3:application=4:scope=5",
"provider": "$scope-type-uuid",
"profiles": [
"environment_development",
"country_argentina"
]
},
"service": {
"id": "9a4c1f2e-7b8d-4f6a-9c3e-1d2b8e5a6f40",
"dimensions": {
"environment": "development",
"country": "argentina"
}
},
"parameters": {
"scope_id": 5
},
"tags": {
"organization_id": "1",
"organization": "acme-corp",
"account_id": "2",
"account": "main",
"namespace_id": "3",
"namespace": "acme-namespace",
"application_id": "4",
"application": "acme-services-action-app",
"scope_id": "5",
"scope": "my-scope"
}
}
```
#### Response format
```json
{
"results": [
{
"id": "pod-abc123-xyz",
"selector": {
"application_id": "123",
"scope_id": "456",
"deployment_id": "789"
},
"details": {
"namespace": "production",
"ip": "10.0.1.50",
"dns": "10.0.1.50.production.pod.cluster.local",
"cpu": {
"requested": 0.25,
"limit": 0.5
},
"memory": {
"requested": "256Mi",
"limit": "512Mi"
},
"architecture": "x86"
},
"state": "Running",
"launch_time": "2024-01-15T08:00:00Z",
"spot": false
}
]
}
```
| Field | Type | Required | Description |
|-------|------|----------|-------------|
| `results` | array | Yes | Array of instance objects |
| `results[].id` | string | Yes | Unique instance identifier |
| `results[].selector` | object | Yes | Labels/metadata for filtering |
| `results[].details` | object | Yes | Instance details |
| `results[].details.namespace` | string | No | Deployment namespace |
| `results[].details.ip` | string | No | Instance IP address |
| `results[].details.dns` | string | No | Instance DNS name |
| `results[].details.cpu` | object | No | CPU resource allocation |
| `results[].details.cpu.requested` | number | No | Requested CPU cores |
| `results[].details.cpu.limit` | number | No | CPU limit in cores |
| `results[].details.memory` | object | No | Memory resource allocation |
| `results[].details.memory.requested` | string | No | Requested memory |
| `results[].details.memory.limit` | string | No | Memory limit |
| `results[].details.architecture` | string | No | CPU architecture (x86, arm64) |
| `results[].state` | string | Yes | Instance state (Running, Pending, etc.) |
| `results[].launch_time` | string | Yes | ISO 8601 launch timestamp |
| `results[].spot` | boolean | No | Whether instance is a spot/preemptible instance |
---
## Best practices
- **Error Handling**: Always return valid JSON, even on errors. Use the empty results pattern:
```json
{"metric":"","type":"","period_in_seconds":0,"unit":"","results":[]}
```
- **Pagination**: Implement pagination for log endpoints to handle large result sets efficiently.
- **Logging**: Logs and metrics are read by the agent from standard output, so don't print logs while processing
telemetry. That would break the JSON format the agent sends to the nullplatform API.
Send a POST request to the [Notification channel endpoint](https://api.nullplatform.com/notification/channel) with a body like the following:
```bash
curl -X POST 'https://api.nullplatform.com/notification/channel' \
-H 'Content-Type: application/json' \
-H 'Accept: application/json' \
-H 'Authorization: Bearer ' \
-d '{
"nrn": "organization=1:account=2:namespace=3:application=4",
"description": "Telemetry channel for custom provider",
"source": [
"telemetry"
],
"type": "agent",
"configuration": {
"api_key": "AAAA.1234567890abcdef1234567890abcdefPTs=",
"command": {
"data": {
"cmdline": "/root/.np/nullplatform/scopes/entrypoint --service-path=$path-to-your-implementation",
"environment": {
"NP_ACTION_CONTEXT": "'${NOTIFICATION_CONTEXT}'"
}
},
"type": "exec"
},
"selector": {
"environment": "development" // this selectors must match the agent tags.
}
},
"filters": {
"arguments.scope_provider": {
"$eq": "$scope-type-id"
}
}
}'
```
Send a POST request using the CLI. See [Notification channel endpoint](https://api.nullplatform.com/notification/channel) for more details.
```bash
np notification channel create \
--body '{
"nrn": "organization=1:account=2:namespace=3:application=4",
"description": "Telemetry channel for custom provider",
"source": [
"telemetry"
],
"type": "agent",
"configuration": {
"api_key": "AAAA.1234567890abcdef1234567890abcdefPTs=",
"command": {
"data": {
"cmdline": "/root/.np/nullplatform/scopes/entrypoint --service-path=$path-to-your-implementation",
"environment": {
"NP_ACTION_CONTEXT": "'${NOTIFICATION_CONTEXT}'"
}
},
"type": "exec"
},
"selector": {
"environment": "development" // this selectors must match the agent tags.
}
},
"filters": {
"arguments.scope_provider": {
"$eq": "$scope-type-id"
}
}
}'
```
:::note
The **selectors** you define here **must match the tags assigned to your agent**.
:::
#### Example command configuration
Suppose your GitHub organization is `acme-corp` and you have a repo named `telemetry` that implements a
provider named `grafana`. In that case, the script you configure in the channel would be:
```bash
/root/.np/nullplatform/scopes/entrypoint --service-path=/root/.np/acme-corp/telemetry/grafana
```
## Required implementations for logs or metrics
You can implement **logs, metrics, or both**. Use the operations below based on what you need.
## Logs
To **implement a logs provider**, define the following operations.
| Operation | Purpose | Workflow Path |
|-------------------|---------|---------------|
| [Read logs](#read-logs) | Retrieve application logs | `log/workflows/log.yaml` |
### Read logs
Retrieves application logs from your logging backend. This enables log viewing within the nullplatform UI.
#### Workflow path
```
/log/workflows/log.yaml
```
#### Input
The following JSON is provided via the `NP_ACTION_CONTEXT` environment variable:
```json
{
"action": "log:read",
"entity_nrn": "organization=1:account=2:namespace=3:application=4:scope=5",
"arguments": {
"log_type": "application",
"application_id": "4",
"scope_id": "5",
"limit": 100,
"start_time": 1769019098258,
"end_time": 1769018602617,
"scope_type": "custom",
"scope_provider": "$scope-type-uuid"
},
"scope": {
"id": 5,
"slug": "my-scope",
"name": "my-scope",
"type": "custom",
"nrn": "organization=1:account=2:namespace=3:application=4:scope=5",
"provider": "$scope-type-uuid",
"profiles": [
"environment_development",
"country_argentina"
]
},
"service": {
"id": "9a4c1f2e-7b8d-4f6a-9c3e-1d2b8e5a6f40",
"dimensions": {
"environment": "development",
"country": "argentina"
}
},
"parameters": {
"scope_id": 5
},
"tags": {
"organization_id": "1",
"organization": "acme-corp",
"account_id": "2",
"account": "main",
"namespace_id": "3",
"namespace": "acme-namespace",
"application_id": "4",
"application": "acme-services-action-app",
"scope_id": "5",
"scope": "my-scope"
}
}
```
#### Response format
Your script must output a JSON object to `stdout` with the following structure:
```json
{
"results": [
{
"datetime": "2024-01-15T10:30:00.000Z",
"message": "Application started successfully"
},
{
"timestamp": "2024-01-15T10:30:01.500Z",
"message": "Connected to database"
}
],
"next_page_token": "eyJwYdlIMDAsInQiOR9="
}
```
| Field | Type | Required | Description |
|-------|------|----------|-------------|
| `results` | array | Yes | Array of log entries |
| `results[].timestamp` | string | Yes | ISO 8601 formatted timestamp |
| `results[].message` | string | Yes | Log message content |
| `next_page_token` | string | No | Token for pagination; omit if no more results |
## Metrics
To **implement a metrics provider**, define the following operations.
| Operation | Purpose | Workflow Path |
|----------------------------------------|---------|---------------|
| [List available metrics](#list-available-metrics) | Enumerate available metrics | `metric/workflows/list.yaml` |
| [Read metric](#read-metric) | Fetch time-series metrics | `metric/workflows/metric.yaml` |
| [List instances](#list-instances) | List running instances for a scope | `instance/workflows/list.yaml` |
### List available metrics
Lists the metrics available from your backend for discovery in the nullplatform UI.
#### Workflow path
```
/metric/workflows/list.yaml
```
#### Input
The following JSON is provided via the `NP_ACTION_CONTEXT` environment variable:
```json
{
"action": "metric:list",
"entity_nrn": "organization=1:account=2:namespace=3:application=4:scope=5",
"arguments": {
"application_id": "4",
"scope_type": "custom",
"scope_provider": "$scope-type-uuid"
},
"scope": {
"id": 5,
"slug": "my-scope",
"name": "my-scope",
"type": "custom",
"nrn": "organization=1:account=2:namespace=3:application=4:scope=5",
"provider": "$scope-type-uuid",
"profiles": [
"environment_development",
"country_argentina"
]
},
"service": {
"id": "9a4c1f2e-7b8d-4f6a-9c3e-1d2b8e5a6f40",
"dimensions": {
"environment": "development",
"country": "argentina"
}
},
"parameters": {
"scope_id": 5
},
"tags": {
"organization_id": "1",
"organization": "acme-corp",
"account_id": "2",
"account": "main",
"namespace_id": "3",
"namespace": "acme-namespace",
"application_id": "4",
"application": "acme-services-action-app",
"scope_id": "5",
"scope": "my-scope"
}
}
```
#### Response format
```json
{
"results": [
{
"name": "http.rpm",
"title": "Throughput",
"unit": "rpm",
"available_filters": ["scope_id", "instance_id"],
"available_group_by": ["instance_id"]
},
{
"name": "http.response_time",
"title": "Response Time",
"unit": "ms",
"available_filters": ["scope_id", "instance_id"],
"available_group_by": ["instance_id"]
},
{
"name": "http.error_rate",
"title": "Error Rate",
"unit": "%",
"available_filters": ["scope_id", "instance_id"],
"available_group_by": ["instance_id"]
},
{
"name": "system.cpu_usage_percentage",
"title": "CPU Usage",
"unit": "%",
"available_filters": ["scope_id", "instance_id"],
"available_group_by": ["instance_id"]
},
{
"name": "system.memory_usage_percentage",
"title": "Memory Usage",
"unit": "%",
"available_filters": ["scope_id", "instance_id"],
"available_group_by": ["scope_id", "instance_id"]
}
]
}
```
| Field | Type | Required | Description |
|-------|------|----------|-------------|
| `results` | array | Yes | Array of available metrics |
| `results[].name` | string | Yes | Metric identifier used in API calls |
| `results[].title` | string | Yes | Human-readable display name |
| `results[].unit` | string | Yes | Unit of measurement for display |
| `results[].available_filters` | array | Yes | Supported filter dimensions |
| `results[].available_group_by` | array | Yes | Supported grouping dimensions |
### Read metric
Fetches time-series metric data for visualization and alerting in nullplatform.
#### Workflow path
```
/metric/workflows/metric.yaml
```
#### Input
The following JSON is provided via the `NP_ACTION_CONTEXT` environment variable:
```json
{
"action": "metric:data",
"entity_nrn": "organization=1:account=2:namespace=3:application=4:scope=5",
"arguments": {
"metric": "http.error_rate",
"start_time": "2026-01-21T18:26:49.689Z",
"end_time": "2026-01-21T18:56:49.689Z",
"filters": {
"scope": "my-scope"
},
"period": 60,
"group_by": [],
"application_id": 4,
"scope_id": "5",
"options": {},
"scope_type": "custom",
"scope_provider": "$scope-type-uuid"
},
"scope": {
"id": 5,
"slug": "my-scope",
"name": "my-scope",
"type": "custom",
"nrn": "organization=1:account=2:namespace=3:application=4:scope=5",
"provider": "$scope-type-uuid",
"profiles": [
"environment_development",
"country_argentina"
]
},
"service": {
"id": "9a4c1f2e-7b8d-4f6a-9c3e-1d2b8e5a6f40",
"dimensions": {
"environment": "development",
"country": "argentina"
}
},
"parameters": {
"scope_id": 5
},
"tags": {
"organization_id": "1",
"organization": "acme-corp",
"account_id": "2",
"account": "main",
"namespace_id": "3",
"namespace": "acme-namespace",
"application_id": "4",
"application": "acme-services-action-app",
"scope_id": "5",
"scope": "my-scope"
}
}
```
#### Supported metric names
The supported metric names are the ones you defined in your metric list implementation.
#### Response format
```json
{
"metric": "http.rpm",
"type": "gauge",
"period_in_seconds": 60,
"unit": "count_per_minute",
"results": [
{
"selector": {
"scope_id": "456",
"instance_id": "pod-abc123"
},
"data": [
{
"timestamp": "2024-01-15T10:00:00Z",
"value": 1250.5
},
{
"timestamp": "2024-01-15T10:01:00Z",
"value": 1340.2
}
]
}
]
}
```
| Field | Type | Required | Description |
|-------|------|----------|-------------|
| `metric` | string | Yes | The metric name |
| `type` | string | Yes | Metric type (`gauge`, `counter`) |
| `period_in_seconds` | number | Yes | Data point aggregation period |
| `unit` | string | Yes | Unit of measurement |
| `results` | array | Yes | Array of time series |
| `results[].selector` | object | Yes | Labels identifying the series |
| `results[].data` | array | Yes | Array of data points |
| `results[].data[].timestamp` | string | Yes | ISO 8601 timestamp |
| `results[].data[].value` | number | Yes | Metric value |
### List instances
Lists running instances (pods, containers, VMs) for a scope so you can filter metrics per instance in nullplatform.
#### Workflow path
```
/instance/workflows/list.yaml
```
#### Input
The following JSON is provided via the `NP_ACTION_CONTEXT` environment variable:
```json
{
"action": "instance:data",
"entity_nrn": "organization=1:account=2:namespace=3:application=4:scope=5",
"arguments": {
"application_id": [
"4"
],
"scope_id": [
"5"
],
"scope_type": "custom",
"scope_provider": "$scope-type-uuid"
},
"scope": {
"id": 5,
"slug": "my-scope",
"name": "my-scope",
"type": "custom",
"nrn": "organization=1:account=2:namespace=3:application=4:scope=5",
"provider": "$scope-type-uuid",
"profiles": [
"environment_development",
"country_argentina"
]
},
"service": {
"id": "9a4c1f2e-7b8d-4f6a-9c3e-1d2b8e5a6f40",
"dimensions": {
"environment": "development",
"country": "argentina"
}
},
"parameters": {
"scope_id": 5
},
"tags": {
"organization_id": "1",
"organization": "acme-corp",
"account_id": "2",
"account": "main",
"namespace_id": "3",
"namespace": "acme-namespace",
"application_id": "4",
"application": "acme-services-action-app",
"scope_id": "5",
"scope": "my-scope"
}
}
```
#### Response format
```json
{
"results": [
{
"id": "pod-abc123-xyz",
"selector": {
"application_id": "123",
"scope_id": "456",
"deployment_id": "789"
},
"details": {
"namespace": "production",
"ip": "10.0.1.50",
"dns": "10.0.1.50.production.pod.cluster.local",
"cpu": {
"requested": 0.25,
"limit": 0.5
},
"memory": {
"requested": "256Mi",
"limit": "512Mi"
},
"architecture": "x86"
},
"state": "Running",
"launch_time": "2024-01-15T08:00:00Z",
"spot": false
}
]
}
```
| Field | Type | Required | Description |
|-------|------|----------|-------------|
| `results` | array | Yes | Array of instance objects |
| `results[].id` | string | Yes | Unique instance identifier |
| `results[].selector` | object | Yes | Labels/metadata for filtering |
| `results[].details` | object | Yes | Instance details |
| `results[].details.namespace` | string | No | Deployment namespace |
| `results[].details.ip` | string | No | Instance IP address |
| `results[].details.dns` | string | No | Instance DNS name |
| `results[].details.cpu` | object | No | CPU resource allocation |
| `results[].details.cpu.requested` | number | No | Requested CPU cores |
| `results[].details.cpu.limit` | number | No | CPU limit in cores |
| `results[].details.memory` | object | No | Memory resource allocation |
| `results[].details.memory.requested` | string | No | Requested memory |
| `results[].details.memory.limit` | string | No | Memory limit |
| `results[].details.architecture` | string | No | CPU architecture (x86, arm64) |
| `results[].state` | string | Yes | Instance state (Running, Pending, etc.) |
| `results[].launch_time` | string | Yes | ISO 8601 launch timestamp |
| `results[].spot` | boolean | No | Whether instance is a spot/preemptible instance |
---
## Best practices
- **Error Handling**: Always return valid JSON, even on errors. Use the empty results pattern:
```json
{"metric":"","type":"","period_in_seconds":0,"unit":"","results":[]}
```
- **Pagination**: Implement pagination for log endpoints to handle large result sets efficiently.
- **Logging**: Logs and metrics are read by the agent from standard output, so don't print logs while processing
telemetry. That would break the JSON format the agent sends to the nullplatform API.