---
sidebar_label: "Services: metrics"
doc_id: b3f6d2c9-8a7e-4c1f-9e5a-2f4d8c6b1a90
description: >-
Configure custom performance metric providers for services using the nullplatform agent.
keywords:
- observability
- metrics
- telemetry
- agent
- services
---
import Tabs from '@theme/Tabs';
import TabItem from '@theme/TabItem';
# Configure a custom metrics provider for services
Extend nullplatform's observability by **implementing custom metric providers** for services. This guide shows how to configure
your provider and channel for any backend, so performance metrics appear in the UI.
## When to use this
Use a custom telemetry provider if nullplatform doesn't support your product (for example, Grafana) or if telemetry
only exists in a private environment that nullplatform can't reach (for example, an Elasticsearch instance in your
infrastructure).
To do this, you'll use [the nullplatform agent](/docs/agent/overview), which lets you:
1. Implement and **run your own scripts to collect metrics** from any provider.
2. Keep those providers private, because **the agent runs in your infrastructure** and can access them **without exposing
them externally**.
## Prerequisites
You'll need the following before configuring a custom telemetry provider:
- The [nullplatform agent](/docs/agent/installation) installed and configured.
- An [API key](/docs/authorization/api-keys) with the necessary permissions: **agent**, **developer**, and **ops**.
## Configure the channel
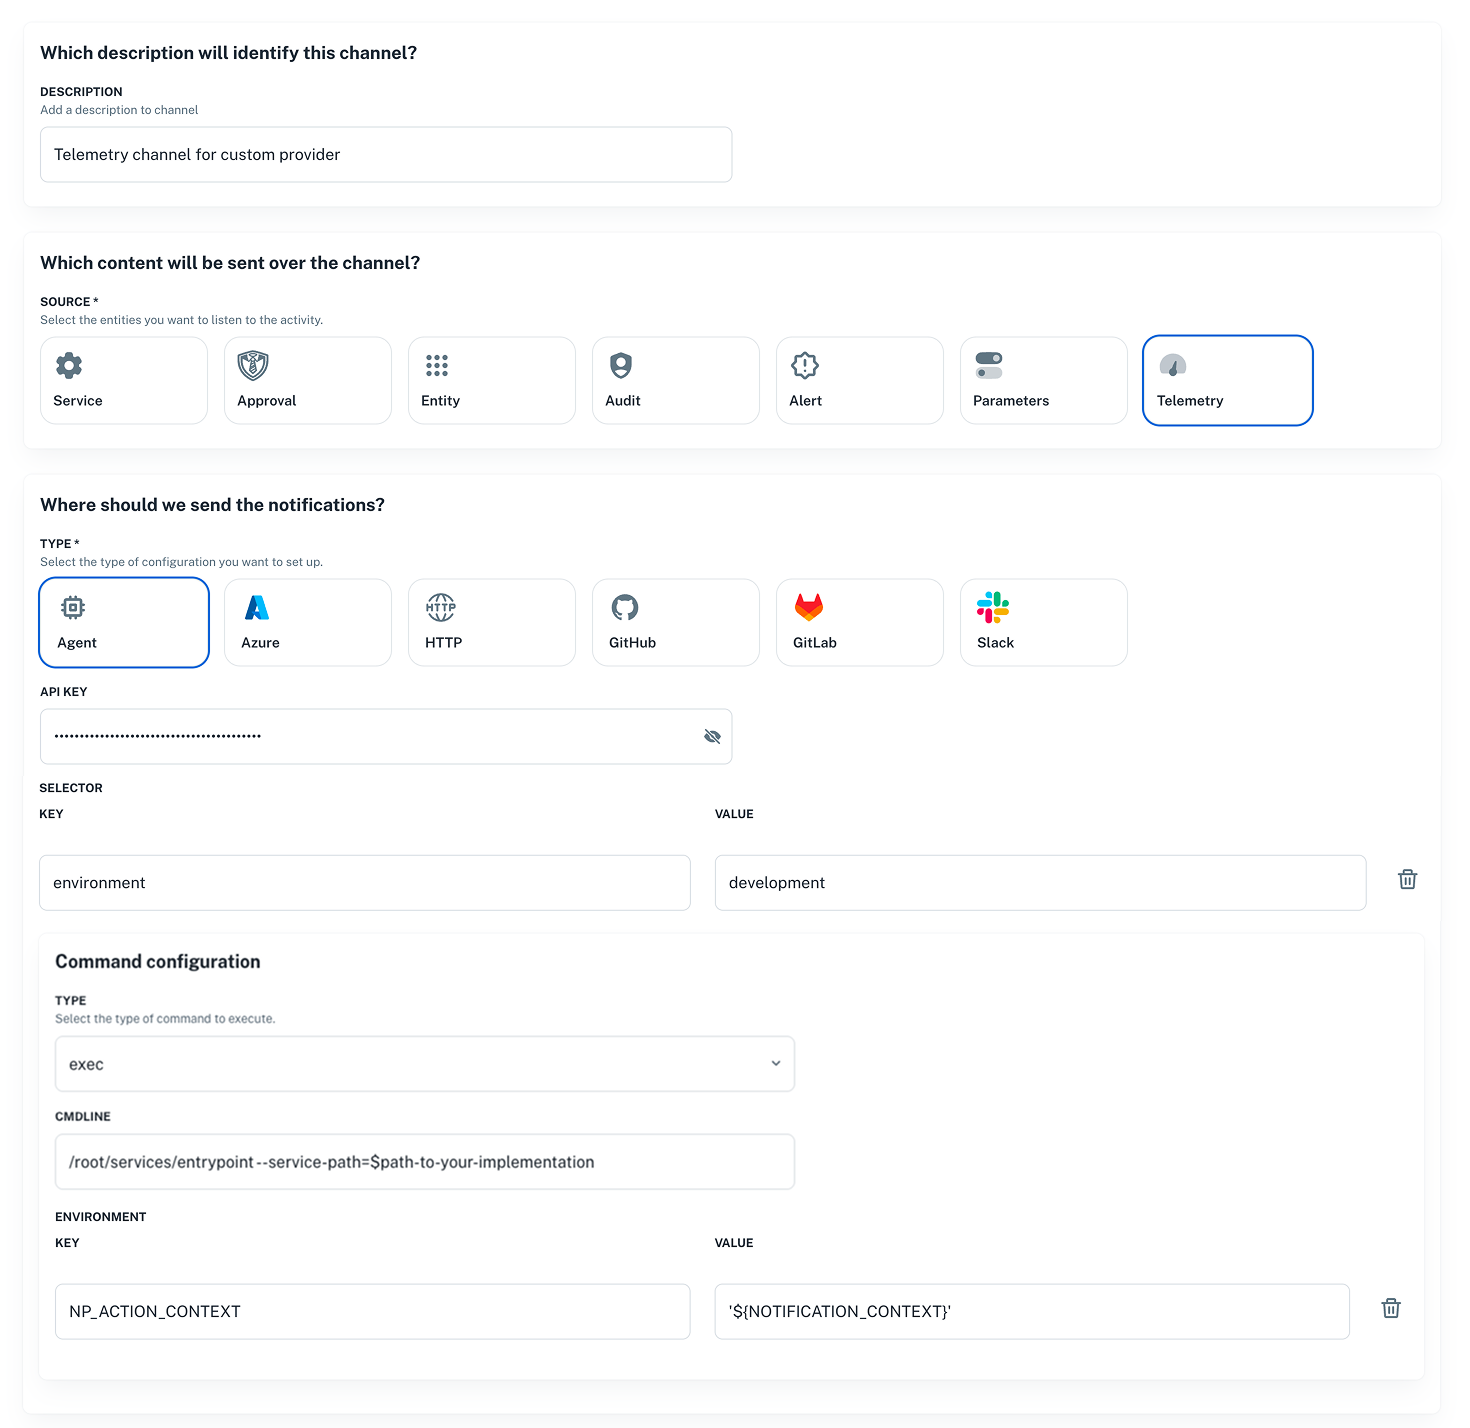
To use a custom telemetry provider with nullplatform, you need to configure a **notification channel** with
`"source": ["telemetry"]`, to tell nullplatform where and how to reach your provider.
This notification channel will:
- Consume "telemetry" notifications.
- Use the nullplatform agent as the execution runtime.
- Execute a script that points to your implementation.
Go to **Platform settings > Notifications > Channels** and click **+ New channel**.
 ### Define filters for the service
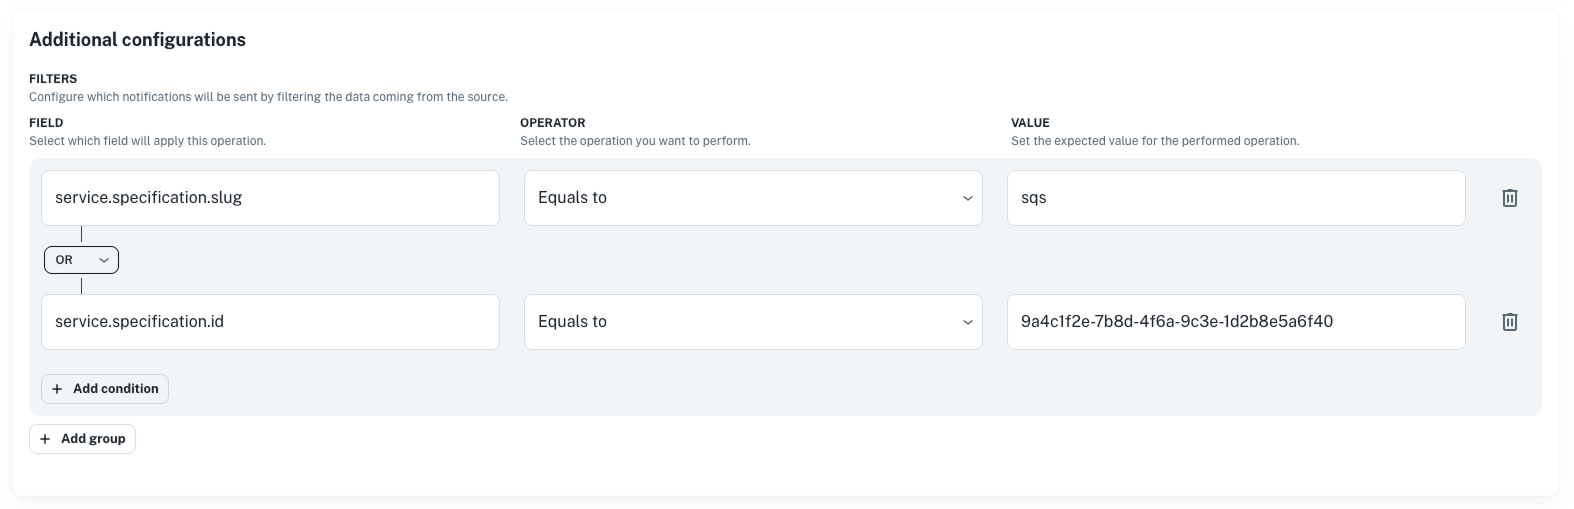
The filters you define in the channel must include a condition for service slug or service specification to ensure that the
notifications are routed to the correct service.
Here's an example of how to set up the filters:
### Define filters for the service
The filters you define in the channel must include a condition for service slug or service specification to ensure that the
notifications are routed to the correct service.
Here's an example of how to set up the filters:
 Send a POST request to the [Notification channel endpoint](https://api.nullplatform.com/notification/channel) with a body like the following:
```bash
curl -X POST 'https://api.nullplatform.com/notification/channel' \
-H 'Content-Type: application/json' \
-H 'Accept: application/json' \
-H 'Authorization: Bearer ' \
-d '{
"nrn": "organization=1:account=2:namespace=3:application=4",
"description": "Telemetry channel for custom provider",
"source": [
"telemetry"
],
"type": "agent",
"configuration": {
"api_key": "AAAA.1234567890abcdef1234567890abcdefPTs=",
"command": {
"data": {
"cmdline": "/root/services/entrypoint --service-path=$path-to-your-implementation",
"environment": {
"NP_ACTION_CONTEXT": "'${NOTIFICATION_CONTEXT}'"
}
},
"type": "exec"
},
"selector": {
"environment": "development" // this selectors must match the agent tags.
}
},
"filters": {
"$or": [
{
"service.specification.slug": {
"$eq": "$service-specification-slug"
}
},
{
"arguments.service_id": {
"$eq": "$service-id"
}
}
]
},
}'
```
Send a POST request using the CLI. See [Notification channel endpoint](https://api.nullplatform.com/notification/channel) for more details.
```bash
np notification channel create \
--body '{
"nrn": "organization=1:account=2:namespace=3:application=4",
"description": "Telemetry channel for custom provider",
"source": [
"telemetry"
],
"type": "agent",
"configuration": {
"api_key": "AAAA.1234567890abcdef1234567890abcdefPTs=",
"command": {
"data": {
"cmdline": "/root/services/entrypoint --service-path=$path-to-your-implementation",
"environment": {
"NP_ACTION_CONTEXT": "'${NOTIFICATION_CONTEXT}'"
}
},
"type": "exec"
},
"selector": {
"environment": "development" // this selectors must match the agent tags.
}
},
"filters": {
"$or": [
{
"service.specification.slug": {
"$eq": "$service-specification-slug"
}
},
{
"arguments.service_id": {
"$eq": "$service-id"
}
}
]
}
}'
```
#### Example command configuration
Suppose your GitHub organization is `acme-corp` and you have a repo named `telemetry` that implements a
provider named `grafana`. In that case, the script you configure in the channel would be:
```bash
/root/services/entrypoint --service-path=/root/acme-corp/telemetry/grafana
```
## Required implementations for metrics
You can implement **metrics** for services. Use the operations below based on what you need.
## Metrics
To **implement a metrics provider**, define the following operations.
| Operation | Purpose | Workflow Path |
|----------------------------------------|---------|---------------|
| [List available metrics](#list-available-metrics) | Enumerate available metrics | `metric/workflows/list.yaml` |
| [Read metric](#read-metric) | Fetch time-series metrics | `metric/workflows/metric.yaml` |
#### Best practices for error handling
Always return valid JSON, even on errors. Use the empty results pattern:
```json
{"metric":"","type":"","period_in_seconds":0,"unit":"","results":[]}
```
### List available metrics
Lists the metrics available from your backend for discovery in the nullplatform UI.
#### Workflow path
```
/metric/workflows/list.yaml
```
#### Input
The following JSON is provided via the `NP_ACTION_CONTEXT` environment variable:
```json
{
"action": "metric:list",
"entity_nrn": "organization=1:account=2:namespace=3:application=4:scope=5",
"arguments": {
"application_id": "4",
"service_id": "9a4c1f2e-7b8d-4f6a-9c3e-1d2b8e5a6f40"
},
"service": {
"id": "9a4c1f2e-7b8d-4f6a-9c3e-1d2b8e5a6f40",
"dimensions": {
"environment": "development",
"country": "argentina"
}
},
"parameters": {
"service_id": "9a4c1f2e-7b8d-4f6a-9c3e-1d2b8e5a6f40"
},
"tags": {
"organization_id": "1",
"organization": "acme-corp",
"account_id": "2",
"account": "main",
"namespace_id": "3",
"namespace": "acme-namespace",
"application_id": "4",
"application": "acme-services-action-app",
"scope_id": "5",
"scope": "my-scope"
}
}
```
#### Response format
```json
{
"results": [
{
"name": "http.rpm",
"title": "Throughput",
"unit": "rpm",
"available_filters": [
"service_id",
],
"available_group_by":[
"service_id",
],
},
{
"name": "http.response_time",
"title": "Response Time",
"unit": "ms",
"available_filters": [
"service_id",
],
"available_group_by": [
"service_id",
],
},
{
"name": "http.error_rate",
"title": "Error Rate",
"unit": "%",
"available_filters": [
"service_id",
],
"available_group_by": [
"service_id",
],
},
{
"name": "system.cpu_usage_percentage",
"title": "CPU Usage",
"unit": "%",
"available_filters": [
"service_id",
],
"available_group_by": [
"service_id",
],
},
{
"name": "system.memory_usage_percentage",
"title": "Memory Usage",
"unit": "%",
"available_filters": [
"service_id",
],
"available_group_by": [
"service_id",
]
}
]
}
```
| Field | Type | Required | Description |
|-------|------|----------|-------------|
| `results` | array | Yes | Array of available metrics |
| `results[].name` | string | Yes | Metric identifier used in API calls |
| `results[].title` | string | Yes | Human-readable display name |
| `results[].unit` | string | Yes | Unit of measurement for display |
| `results[].available_filters` | array | Yes | Supported filter dimensions |
| `results[].available_group_by` | array | Yes | Supported grouping dimensions |
### Read metric
Fetches time-series metric data for visualization and alerting in nullplatform.
#### Workflow path
```
/metric/workflows/metric.yaml
```
#### Input
The following JSON is provided via the `NP_ACTION_CONTEXT` environment variable:
```json
{
"action": "metric:data",
"entity_nrn": "organization=1:account=2:namespace=3:application=4:scope=5",
"arguments": {
"metric": "http.error_rate",
"start_time": "2026-01-21T18:26:49.689Z",
"end_time": "2026-01-21T18:56:49.689Z",
"filters": {
"service_id": "9a4c1f2e-7b8d-4f6a-9c3e-1d2b8e5a6f40"
},
"period": 60,
"group_by": [],
"application_id": 4,
"options": {},
"service_id": "9a4c1f2e-7b8d-4f6a-9c3e-1d2b8e5a6f40"
},
"service": {
"id": "9a4c1f2e-7b8d-4f6a-9c3e-1d2b8e5a6f40",
"dimensions": {
"environment": "development",
"country": "argentina"
}
},
"parameters": {
"service_id": "9a4c1f2e-7b8d-4f6a-9c3e-1d2b8e5a6f40",
},
"tags": {
"organization_id": "1",
"organization": "acme-corp",
"account_id": "2",
"account": "main",
"namespace_id": "3",
"namespace": "acme-namespace",
"application_id": "4",
"application": "acme-services-action-app",
"scope_id": "5",
"scope": "my-scope"
}
}
```
#### Supported metric names
The supported metric names are the ones you defined in your metric list implementation.
#### Response format
```json
{
"metric": "http.rpm",
"type": "gauge",
"period_in_seconds": 60,
"unit": "count_per_minute",
"results": [
{
"selector": {
"service_id": "",
},
"data": [
{
"timestamp": "2024-01-15T10:00:00Z",
"value": 1250.5
},
{
"timestamp": "2024-01-15T10:01:00Z",
"value": 1340.2
}
]
}
]
}
```
| Field | Type | Required | Description |
|-------|------|----------|-------------|
| `metric` | string | Yes | The metric name |
| `type` | string | Yes | Metric type (`gauge`, `counter`) |
| `period_in_seconds` | number | Yes | Data point aggregation period |
| `unit` | string | Yes | Unit of measurement |
| `results` | array | Yes | Array of time series |
| `results[].selector` | object | Yes | Labels identifying the series |
| `results[].data` | array | Yes | Array of data points |
| `results[].data[].timestamp` | string | Yes | ISO 8601 timestamp |
| `results[].data[].value` | number | Yes | Metric value |
Send a POST request to the [Notification channel endpoint](https://api.nullplatform.com/notification/channel) with a body like the following:
```bash
curl -X POST 'https://api.nullplatform.com/notification/channel' \
-H 'Content-Type: application/json' \
-H 'Accept: application/json' \
-H 'Authorization: Bearer ' \
-d '{
"nrn": "organization=1:account=2:namespace=3:application=4",
"description": "Telemetry channel for custom provider",
"source": [
"telemetry"
],
"type": "agent",
"configuration": {
"api_key": "AAAA.1234567890abcdef1234567890abcdefPTs=",
"command": {
"data": {
"cmdline": "/root/services/entrypoint --service-path=$path-to-your-implementation",
"environment": {
"NP_ACTION_CONTEXT": "'${NOTIFICATION_CONTEXT}'"
}
},
"type": "exec"
},
"selector": {
"environment": "development" // this selectors must match the agent tags.
}
},
"filters": {
"$or": [
{
"service.specification.slug": {
"$eq": "$service-specification-slug"
}
},
{
"arguments.service_id": {
"$eq": "$service-id"
}
}
]
},
}'
```
Send a POST request using the CLI. See [Notification channel endpoint](https://api.nullplatform.com/notification/channel) for more details.
```bash
np notification channel create \
--body '{
"nrn": "organization=1:account=2:namespace=3:application=4",
"description": "Telemetry channel for custom provider",
"source": [
"telemetry"
],
"type": "agent",
"configuration": {
"api_key": "AAAA.1234567890abcdef1234567890abcdefPTs=",
"command": {
"data": {
"cmdline": "/root/services/entrypoint --service-path=$path-to-your-implementation",
"environment": {
"NP_ACTION_CONTEXT": "'${NOTIFICATION_CONTEXT}'"
}
},
"type": "exec"
},
"selector": {
"environment": "development" // this selectors must match the agent tags.
}
},
"filters": {
"$or": [
{
"service.specification.slug": {
"$eq": "$service-specification-slug"
}
},
{
"arguments.service_id": {
"$eq": "$service-id"
}
}
]
}
}'
```
#### Example command configuration
Suppose your GitHub organization is `acme-corp` and you have a repo named `telemetry` that implements a
provider named `grafana`. In that case, the script you configure in the channel would be:
```bash
/root/services/entrypoint --service-path=/root/acme-corp/telemetry/grafana
```
## Required implementations for metrics
You can implement **metrics** for services. Use the operations below based on what you need.
## Metrics
To **implement a metrics provider**, define the following operations.
| Operation | Purpose | Workflow Path |
|----------------------------------------|---------|---------------|
| [List available metrics](#list-available-metrics) | Enumerate available metrics | `metric/workflows/list.yaml` |
| [Read metric](#read-metric) | Fetch time-series metrics | `metric/workflows/metric.yaml` |
#### Best practices for error handling
Always return valid JSON, even on errors. Use the empty results pattern:
```json
{"metric":"","type":"","period_in_seconds":0,"unit":"","results":[]}
```
### List available metrics
Lists the metrics available from your backend for discovery in the nullplatform UI.
#### Workflow path
```
/metric/workflows/list.yaml
```
#### Input
The following JSON is provided via the `NP_ACTION_CONTEXT` environment variable:
```json
{
"action": "metric:list",
"entity_nrn": "organization=1:account=2:namespace=3:application=4:scope=5",
"arguments": {
"application_id": "4",
"service_id": "9a4c1f2e-7b8d-4f6a-9c3e-1d2b8e5a6f40"
},
"service": {
"id": "9a4c1f2e-7b8d-4f6a-9c3e-1d2b8e5a6f40",
"dimensions": {
"environment": "development",
"country": "argentina"
}
},
"parameters": {
"service_id": "9a4c1f2e-7b8d-4f6a-9c3e-1d2b8e5a6f40"
},
"tags": {
"organization_id": "1",
"organization": "acme-corp",
"account_id": "2",
"account": "main",
"namespace_id": "3",
"namespace": "acme-namespace",
"application_id": "4",
"application": "acme-services-action-app",
"scope_id": "5",
"scope": "my-scope"
}
}
```
#### Response format
```json
{
"results": [
{
"name": "http.rpm",
"title": "Throughput",
"unit": "rpm",
"available_filters": [
"service_id",
],
"available_group_by":[
"service_id",
],
},
{
"name": "http.response_time",
"title": "Response Time",
"unit": "ms",
"available_filters": [
"service_id",
],
"available_group_by": [
"service_id",
],
},
{
"name": "http.error_rate",
"title": "Error Rate",
"unit": "%",
"available_filters": [
"service_id",
],
"available_group_by": [
"service_id",
],
},
{
"name": "system.cpu_usage_percentage",
"title": "CPU Usage",
"unit": "%",
"available_filters": [
"service_id",
],
"available_group_by": [
"service_id",
],
},
{
"name": "system.memory_usage_percentage",
"title": "Memory Usage",
"unit": "%",
"available_filters": [
"service_id",
],
"available_group_by": [
"service_id",
]
}
]
}
```
| Field | Type | Required | Description |
|-------|------|----------|-------------|
| `results` | array | Yes | Array of available metrics |
| `results[].name` | string | Yes | Metric identifier used in API calls |
| `results[].title` | string | Yes | Human-readable display name |
| `results[].unit` | string | Yes | Unit of measurement for display |
| `results[].available_filters` | array | Yes | Supported filter dimensions |
| `results[].available_group_by` | array | Yes | Supported grouping dimensions |
### Read metric
Fetches time-series metric data for visualization and alerting in nullplatform.
#### Workflow path
```
/metric/workflows/metric.yaml
```
#### Input
The following JSON is provided via the `NP_ACTION_CONTEXT` environment variable:
```json
{
"action": "metric:data",
"entity_nrn": "organization=1:account=2:namespace=3:application=4:scope=5",
"arguments": {
"metric": "http.error_rate",
"start_time": "2026-01-21T18:26:49.689Z",
"end_time": "2026-01-21T18:56:49.689Z",
"filters": {
"service_id": "9a4c1f2e-7b8d-4f6a-9c3e-1d2b8e5a6f40"
},
"period": 60,
"group_by": [],
"application_id": 4,
"options": {},
"service_id": "9a4c1f2e-7b8d-4f6a-9c3e-1d2b8e5a6f40"
},
"service": {
"id": "9a4c1f2e-7b8d-4f6a-9c3e-1d2b8e5a6f40",
"dimensions": {
"environment": "development",
"country": "argentina"
}
},
"parameters": {
"service_id": "9a4c1f2e-7b8d-4f6a-9c3e-1d2b8e5a6f40",
},
"tags": {
"organization_id": "1",
"organization": "acme-corp",
"account_id": "2",
"account": "main",
"namespace_id": "3",
"namespace": "acme-namespace",
"application_id": "4",
"application": "acme-services-action-app",
"scope_id": "5",
"scope": "my-scope"
}
}
```
#### Supported metric names
The supported metric names are the ones you defined in your metric list implementation.
#### Response format
```json
{
"metric": "http.rpm",
"type": "gauge",
"period_in_seconds": 60,
"unit": "count_per_minute",
"results": [
{
"selector": {
"service_id": "",
},
"data": [
{
"timestamp": "2024-01-15T10:00:00Z",
"value": 1250.5
},
{
"timestamp": "2024-01-15T10:01:00Z",
"value": 1340.2
}
]
}
]
}
```
| Field | Type | Required | Description |
|-------|------|----------|-------------|
| `metric` | string | Yes | The metric name |
| `type` | string | Yes | Metric type (`gauge`, `counter`) |
| `period_in_seconds` | number | Yes | Data point aggregation period |
| `unit` | string | Yes | Unit of measurement |
| `results` | array | Yes | Array of time series |
| `results[].selector` | object | Yes | Labels identifying the series |
| `results[].data` | array | Yes | Array of data points |
| `results[].data[].timestamp` | string | Yes | ISO 8601 timestamp |
| `results[].data[].value` | number | Yes | Metric value |