Right-size Kubernetes workloads
🎯 Goal: Two prompts to your coding assistant, and Kubernetes cost tracks itself: every scope gets a daily price tag on its catalog, over-provisioned scopes get an action item with a sizing suggestion the team applies in one click, and a live dashboard shows the cost and the savings.
Introduction
Resource requests get set once, generously, when a scope is created. Then nobody revisits them: the scope reserves two cores, uses a quarter of one, and the cluster autoscaler quietly buys nodes to honor reservations nobody uses.
That waste is invisible because it has no owner and no number. No team sees what their scope costs, so no team has a reason to lower it. The usual fix is a quarterly FinOps review: someone exports metrics, builds a spreadsheet, and files tickets that are stale by the time they're read.
This suite replaces that review. It takes two prompts:
- One prompt builds the automation: a daily price on every scope, a weekly right-sizing analysis, one self-managing action item per real opportunity, and a weekly verification that closes each item with the saving it actually delivered
- One prompt builds the dashboard that watches the cost and the savings live
From then on, pricing, detection, follow-up, and reporting run on their own.
What you'll set up
- A daily tracker that prices every K8s-backed scope from your cluster's real usage: what it costs, what it actually uses, and the waste between the two, written to the scope's catalog with a 365-day history
- A weekly analysis that compares 14 days of per-pod usage against what each scope reserves, with an AI deep-dive only for the scopes that look wasteful
- One action item per genuine opportunity, with the evidence and the recommended sizing. No duplicates: an already-reported scope keeps its item refreshed, never gets a second one. Findings too small for their own ticket accumulate in a single org-level portfolio item
- One-click apply outside production: the item carries a suggestion the team accepts, choosing to apply on the next deploy, deploy now, or schedule a controlled deploy in a night window steered from the item's comments. Production items report only: the change ships through your normal process
- A weekly verification that detects applied or manual sizing changes from the tracker's own data and closes each item with the realized before/after numbers, flagging any scope the change left running hot
- A live Insights dashboard of cost, waste, and open right-sizing items, so nobody asks "what does this cost us" in a meeting again
💡 Want to see how it works first? Jump to What you just built, then come back.
Prerequisites
This is the most infrastructure-involved suite in these docs, because it measures a real cluster:
- The data lake enabled: scope discovery and the dashboard run on lake queries
- A nullplatform agent running in the cluster you want to price
- A Prometheus in that cluster scraping cAdvisor and kube-state-metrics, reachable from the agent
- The np-workflow skill, part of the nullplatform AI plugins for your coding assistant. See Set up the AI plugins to install it
- Access to Insights for the tracking dashboard
Step 1: Describe the suite to your coding assistant
Open a session of your coding assistant with the np-workflow skill available and describe the automation you want. The prompt below is a good template because it states everything the suite needs to get right: the cost model, the catalog contract, the staged analysis, the action item contract, the production policy, and the escape hatches.
💡 You can start narrow. The suite is built to price every K8s scope, and that's usually the point. If you'd rather limit what it touches on day one, or something similar already runs in your organization, point the prompt at one application or namespace.
/np-workflow create a Kubernetes cost tracking and right-sizing suite
for my organization:

- A daily tracker that prices every active K8s scope from the cluster's
  Prometheus through the nullplatform agent, billing max(usage,
  reserved) per hour. Store each scope's cost, usage cost, and waste on
  its catalog metadata (create the spec if needed), with a bounded
  365-day daily series.
- A weekly scanner, cheapest checks first: skip scopes whose tracker
  history looks healthy or recently analyzed, compare 14 days of
  per-pod usage against requests with per-environment ceilings and
  floors, and have an AI step with a Prometheus metrics tool validate
  whatever survives.
- One idempotent action item per genuine opportunity, in the "FinOps"
  category (create it if needed): the evidence, the recommended
  requests, and, outside production, a suggestion to apply on the next
  deploy, deploy now, or schedule it. Production items report only.
  Refresh instead of duplicating, close with a comment when the scope
  stops qualifying, and collect findings below a monthly-saving floor
  in one org-level portfolio item.
- On an accepted suggestion, patch the scope's requested resources
  (deploying in a night window when the developer chose so), and let
  item comments steer an in-flight deploy (deploy now / abort).
- A weekly closer that verifies outcomes from tracker data alone: when
  a scope's per-pod requests changed (applied or by hand) and it ran
  healthy for three days, close the item with the realized saving;
  when it now runs hot, close with a warning and flag the scope.
- Manual triggers with an optional NRN filter, and a date input on the
  tracker.

Publish everything but don't activate anything yet.
The skill builds the nine workflow definitions (tracker, per-scope collector, scanner, per-scope analysis, metrics tool, events, apply, closer, per-scope verifier), wires the sub-workflow references, checks the result is valid, and publishes it to your organization under a folder like /cost.
Nothing is scheduled yet: "don't activate" leaves you a chance to review first.
The suite reads its configuration from one place. Ask the skill to set the entries as part of the same conversation, or set them later from the editor's configuration panel. The core set:
| Entry | Type | What it is |
|---|---|---|
NP_API_KEY | Secret | API key the workflows use to call nullplatform |
NP_ORGANIZATION_ID | Variable | Your organization id |
COST_AGENT_NRN | Variable | Where to find the agent (an account-level NRN) |
COST_AGENT_CLUSTER | Variable | The agent's cluster tag |
COST_AGENT_CMDLINE | Variable | Collector command on the agent plus your Prometheus URL |
COST_PER_MILLICORE_HOUR / COST_PER_MB_RAM_HOUR | Variable | Unit prices; start with estimates and calibrate later |
RIGHTSIZING_CATEGORY_SLUG | Variable | Action item category for the findings |
RIGHTSIZING_LOOKBACK_DAYS | Variable | Analysis window (default 14) |
DEPLOY_WINDOW_START / DEPLOY_WINDOW_END | Variable | The night window for scheduled deploys |
The suite ships more tuning knobs with sane defaults: the over-provision threshold, per-environment utilization ceilings and platform floors, the minimum monthly saving worth a ticket, and the rescan window that keeps conclusive verdicts from being recomputed weekly.
✅ Checkpoint
The skill reports the nine workflows as published, with activation skipped. You'll see them in the UI in the next step.
Step 2: Meet the suite in the workflow editor
In the nullplatform UI, open Platform Settings → Workflow Editor. The left panel shows your workflows tree: the suite lives in its own folder, with the nine workflows inside. Click the tracker and the canvas draws it: triggers on the left, then each step in the order data flows through it.
This is the same suite you just described, node by node. Use the list on the left to switch between the nine workflows, and click any step to see what it runs:
Daily job (04:00, also manual) that computes yesterday’s cost per active K8s scope from cluster Prometheus usage via the np agent, and upserts each scope’s cost-tracking catalog instance (rollups + 365-day series).
7 steps
Click a node to see the step it runs.
Two things to notice while you're here:
- How small the AI surface is. In the analysis, one step reasons and everything around it collects, filters, and writes deterministically. Its only tool is the metrics tool sitting right there in the same list: open it and you're reading the whole capability the AI gets, a bounded PromQL query. Every query the AI runs is an execution with visible inputs and outputs.
- The lock icon opens Variables & Secrets. That's where the configuration entries live, scoped to the suite's folder so every workflow in it resolves them. Secrets are write-only: you can rotate them, never read them back.
✅ Checkpoint
You can open each of the nine workflows and follow the canvas from trigger to final step.
Step 3: Run the tracker on one application
Don't price the whole organization on your first run. The tracker's manual trigger accepts an optional NRN filter and a date: run it scoped to a single application, for yesterday, and validate the whole metrics path (agent, Prometheus, pod matching, pricing) on a small surface before you trust any number.
Click RUN on the tracker. The dialog renders the trigger's two optional inputs as a form: fill nrn with the application to price (it's a prefix match, so everything under that NRN is covered), and leave date empty to price yesterday.
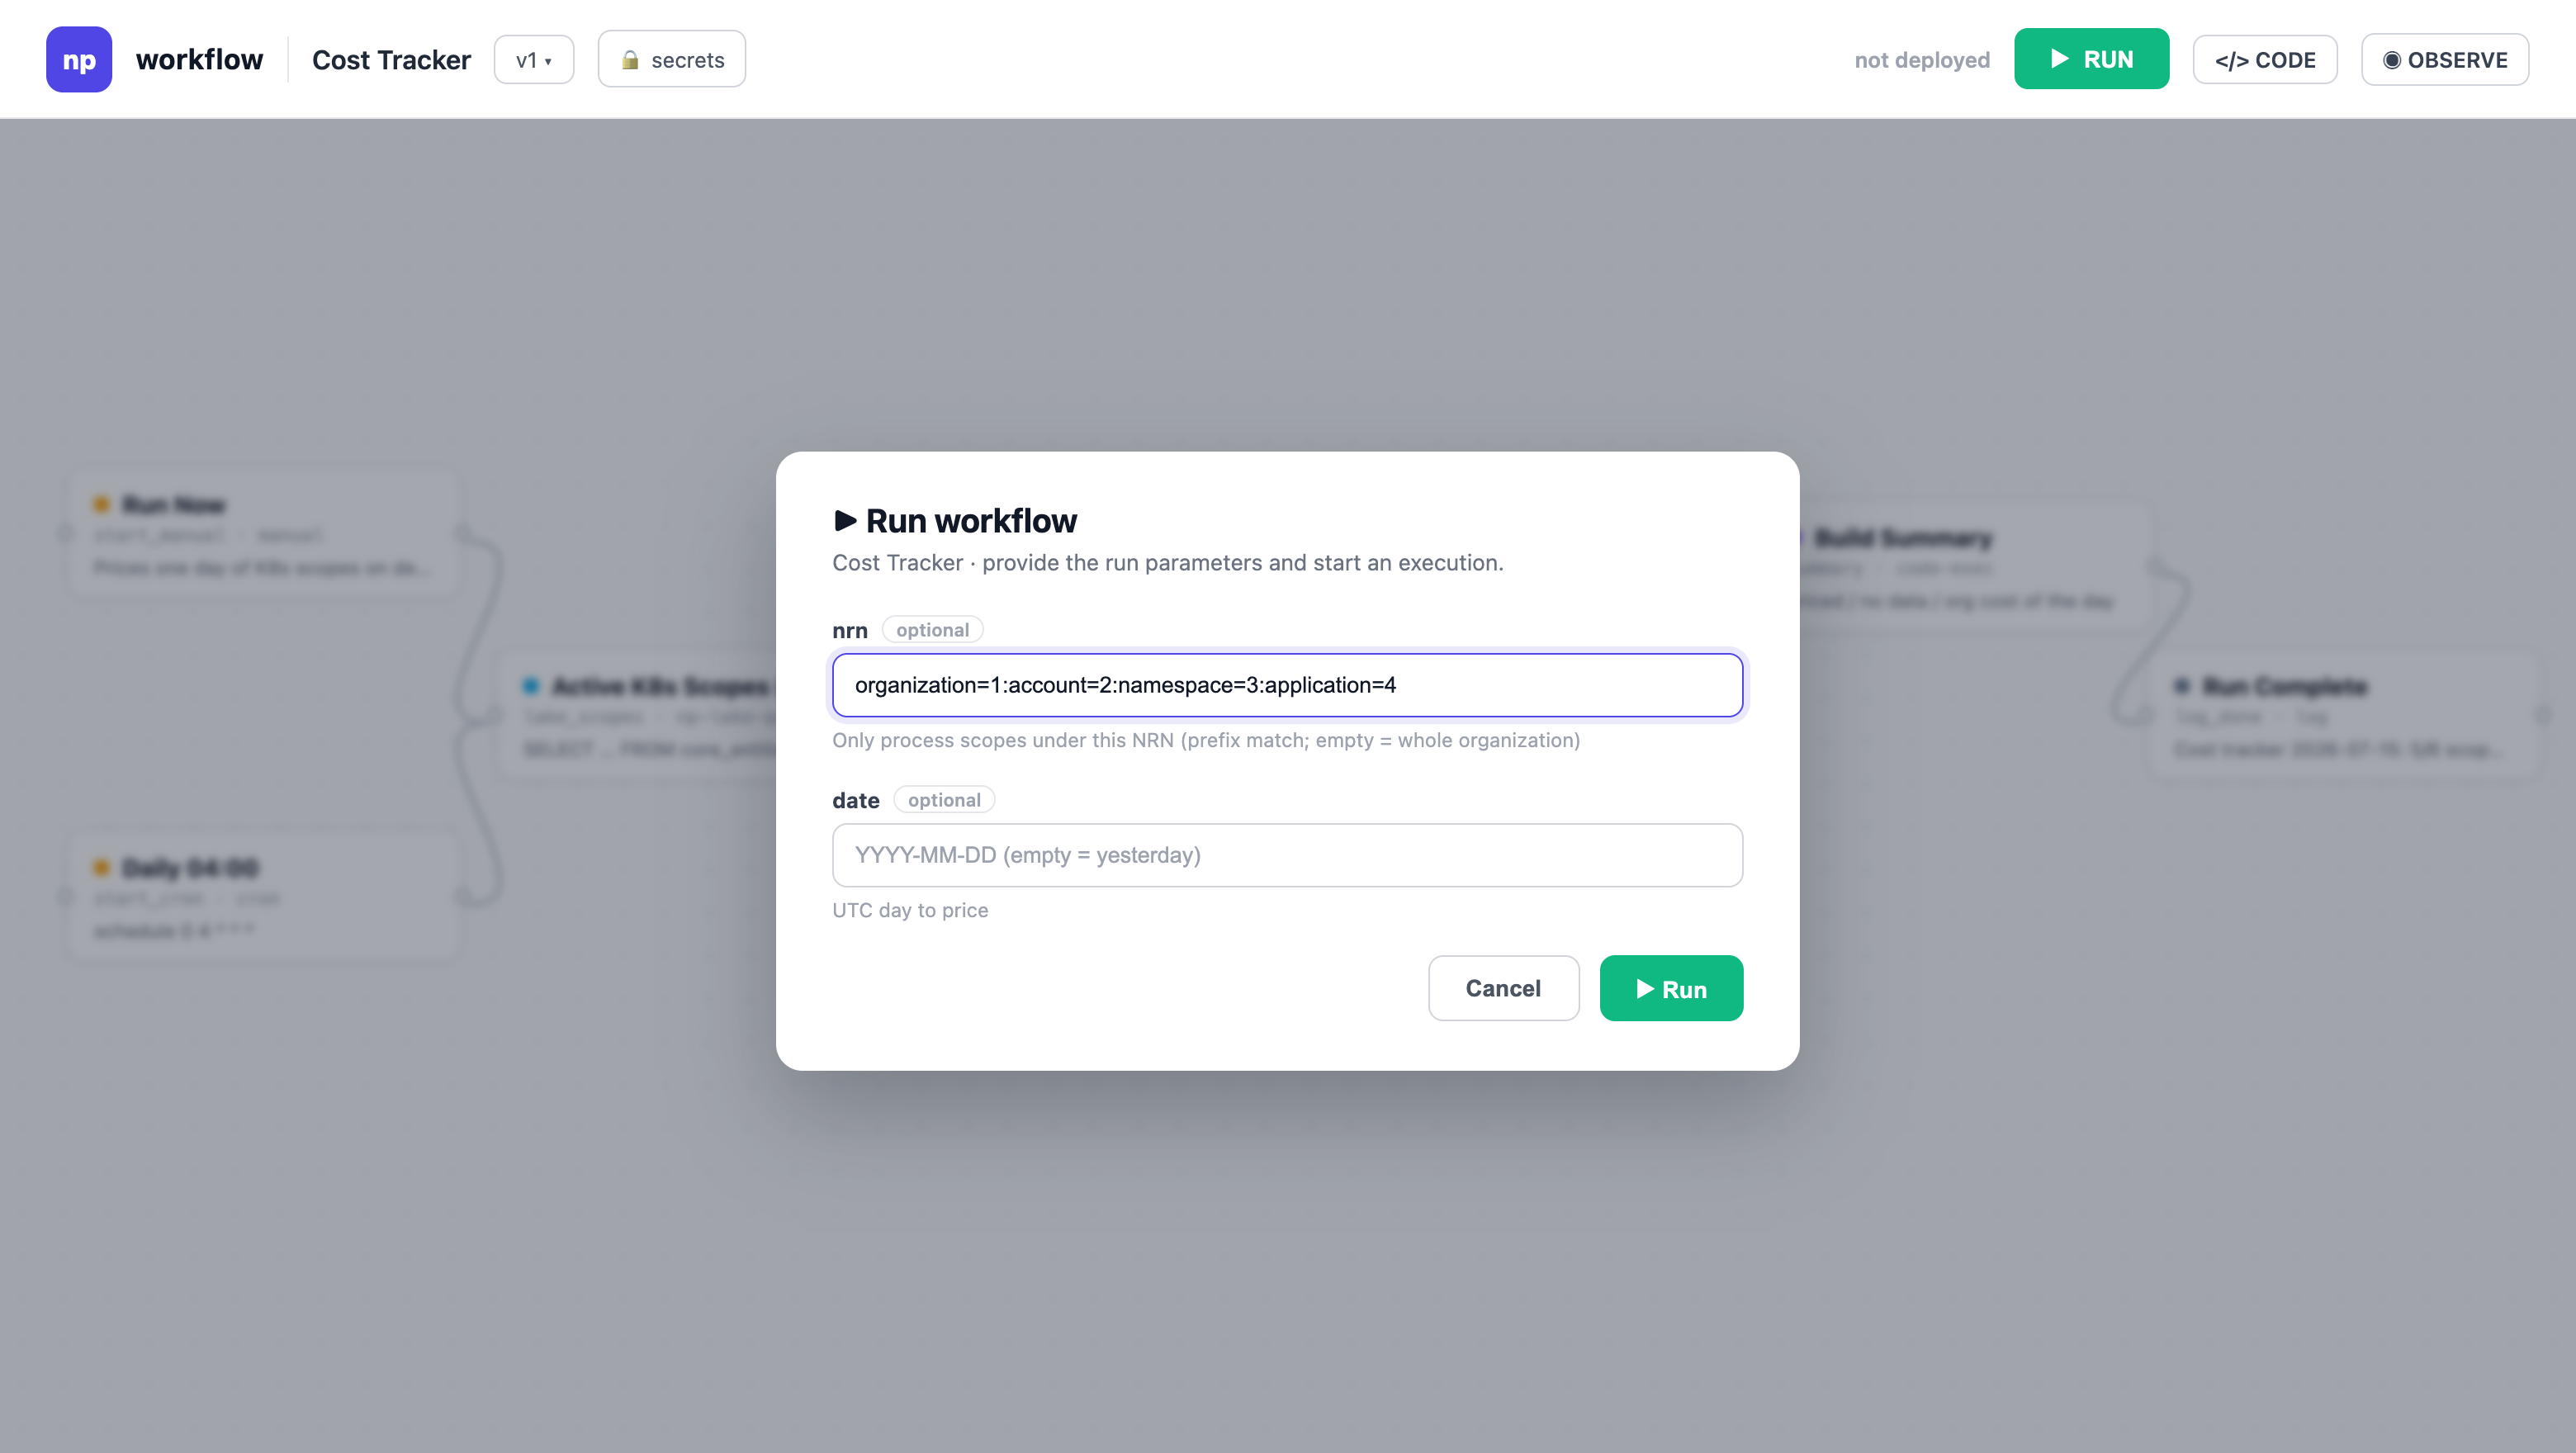
While it runs, the canvas updates live: each node lights up with its status, and the panel below streams logs and per-step inputs and outputs. You can watch the fan-out dispatch one collector per scope and the summary report the totals: how many scopes were priced, how many had no data, and the day's cost for the slice you filtered to.
✅ Checkpoint
The scopes under that application show cost_today, usage_cost_today, and waste_today in their catalog metadata, and the numbers look sane.
Step 4: Scan and see what your developers get
Click RUN on the scanner, with the same NRN filter. Its summary log reports the totals: how many scopes were analyzed, how many the prefilter skipped and why, how many findings the AI confirmed, how many items were created or refreshed, and how many small findings went to the portfolio item instead (savings below the ticket floor accumulate in one org-level item with a per-scope table, so the long tail stays visible without flooding anyone).
Each confirmed scope now has an action item on its application. Open the application and go to Governance → Action Items: the item carries the evidence (average usage versus requests, peaks, the queries behind every number), the recommended requests, the estimated monthly saving, and the suggestion.
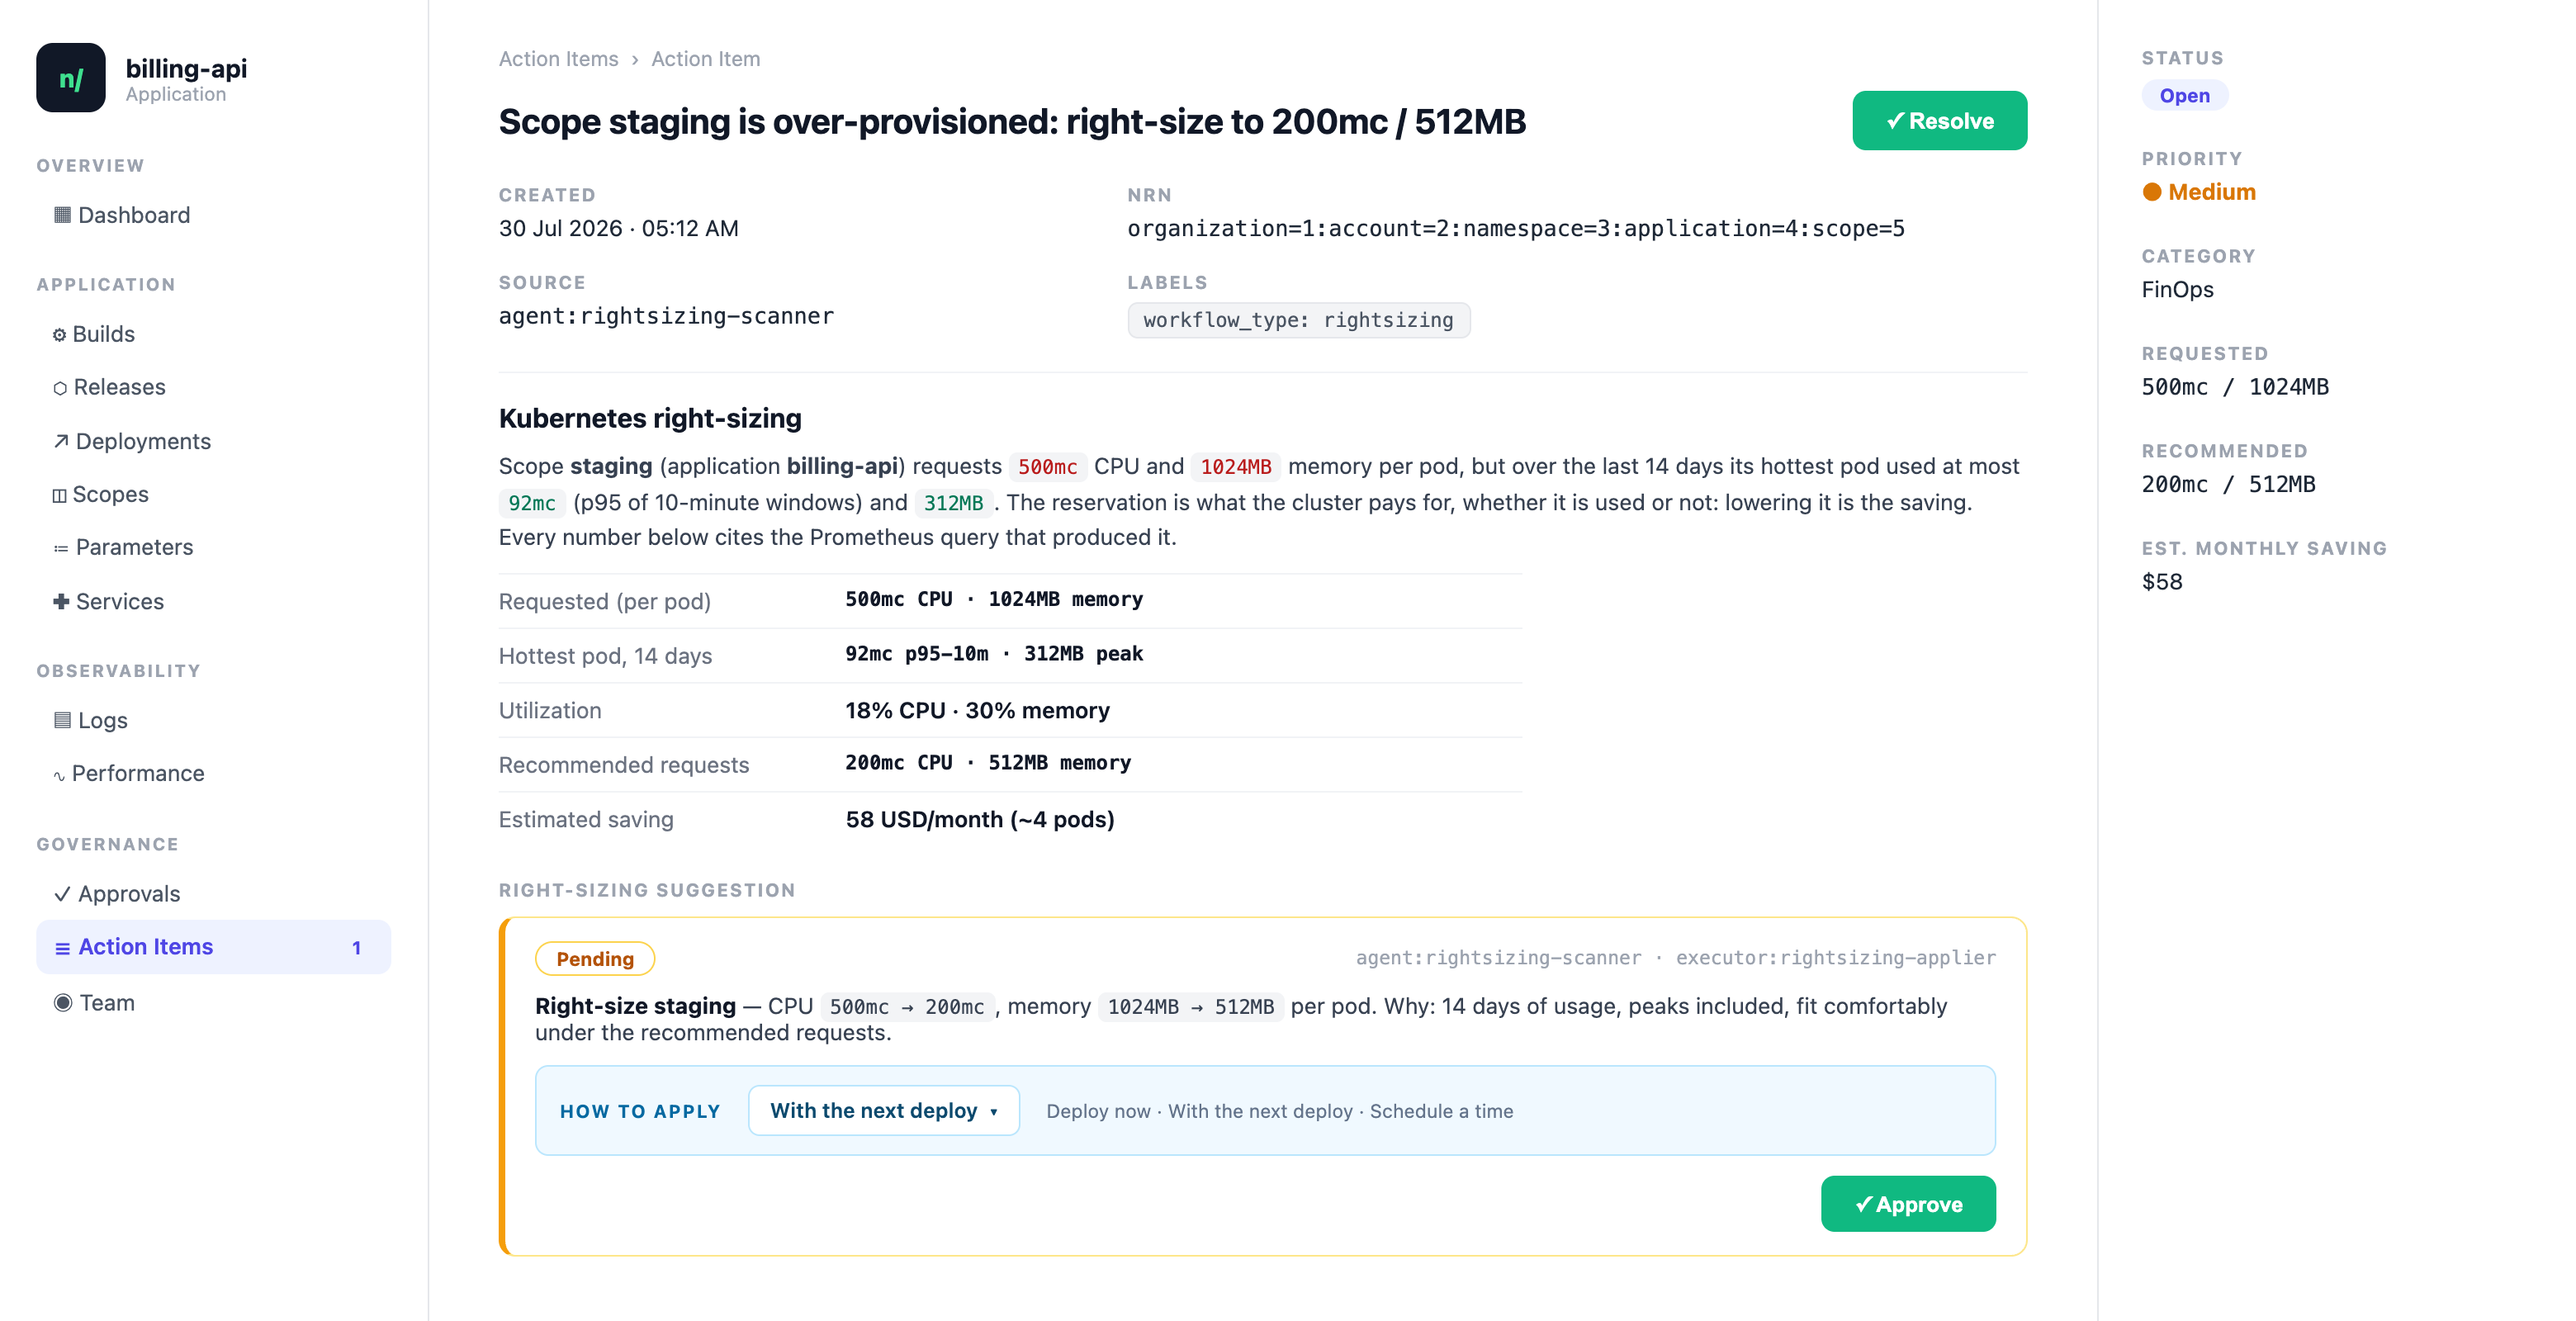
The suggestion is the one-click part, and it waits for a human: nothing is applied until someone approves it. Approving lets the developer choose to apply on the next deploy, deploy now, or schedule it for the night window. Production items carry no suggestion at all: they report the evidence and the recommendation, and the change ships through your normal deployment process, which is exactly why the next piece matters.
Everything past that point is the suite reacting on its own, so it only starts working once you activate it in the next step: the approval hands off to the apply workflow, a "deploy now" or "abort" comment steers an in-flight deploy, and the weekly closer watches every scope with an open item. When it detects the requests actually changed, applied through a suggestion, shipped with a regular deploy, or edited by hand, it waits for a few days of post-change data, comments the realized before-and-after saving, and closes the item. Nobody circles back to check, and no item goes stale.
✅ Checkpoint
An over-provisioned scope shows the action item with the evidence and the sizing suggestion attached.
Step 5: Activate the suite
Happy with what the scoped runs produced? Activate the tracker, the scanner, the events workflow, and the closer. Activation is the moment the schedules and the action item event subscription register; until then, saved workflows have zero side effects. The other five workflows need no activation: their parents start them.
Open each of the four workflows in the editor and click ACTIVATE, right next to RUN in the toolbar. The dialog asks which alias to activate: pick the existing one, or create one if the list is empty (live is a fine default).
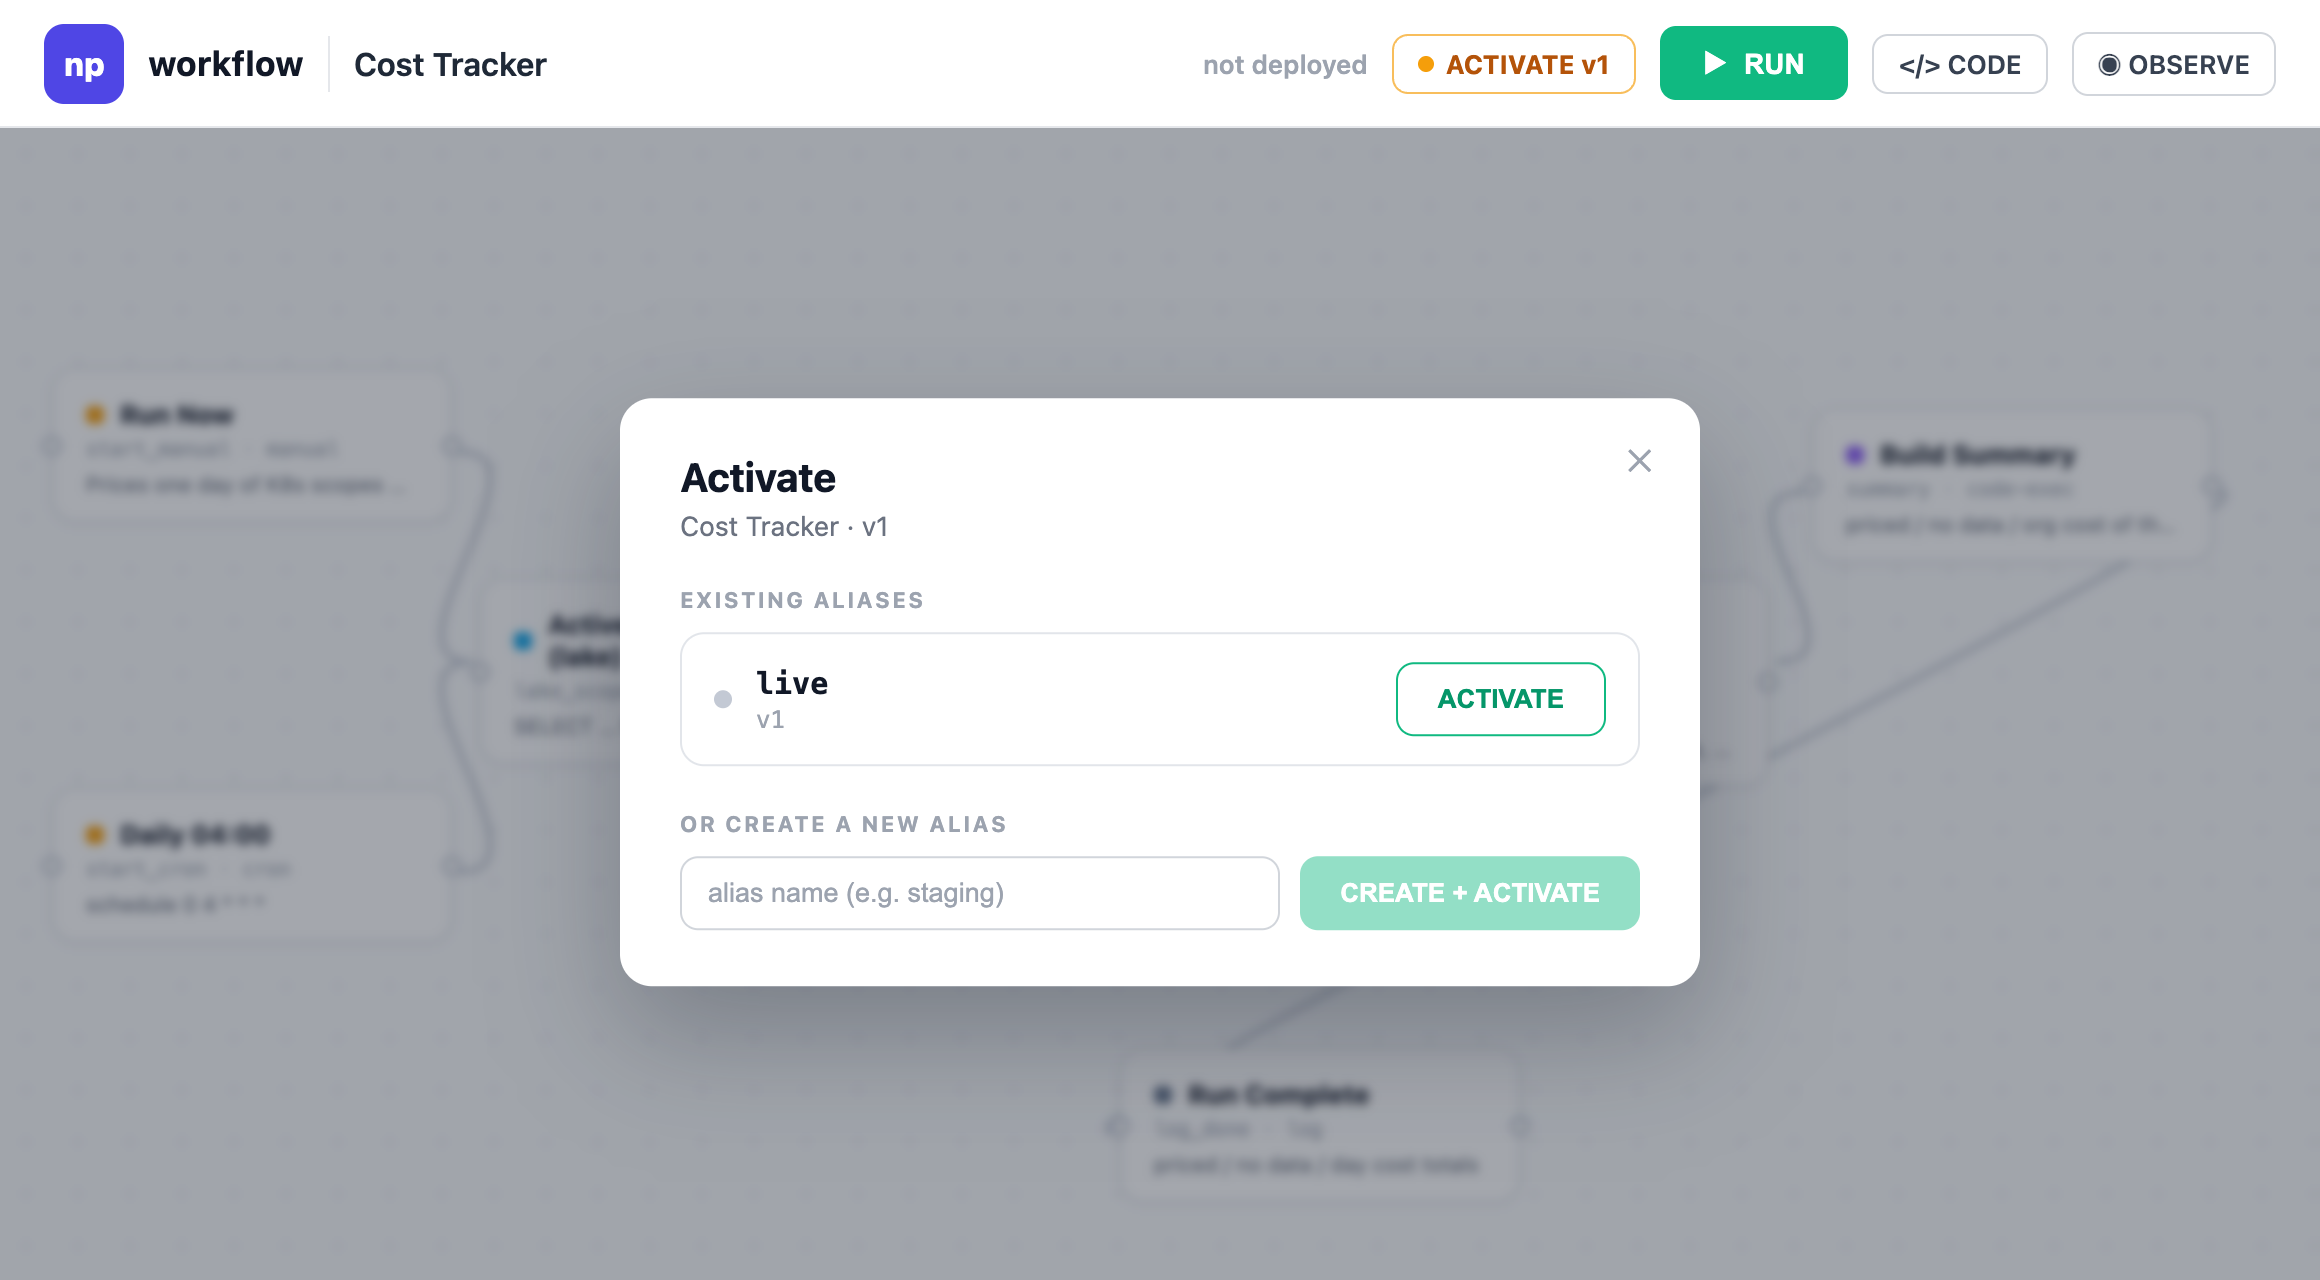
From now on the suite runs on its own schedule: every scope gets yesterday's price by morning, the weekly scan turns real waste into items, accepted suggestions apply themselves on the timing the developer chose, the closer confirms every change with its realized saving a few days later, and stale items close with an explanation.
✅ Checkpoint
The four workflows show as active, and the next morning's tracker run appears in its executions list.
Step 6: Watch the savings in Insights
The suite manages each scope individually, but cost is a fleet-level question: where is the money going, and how much of it is waste? Every number the suite writes is queryable, the catalog through the data lake and the items through the action items API, so you can build that view with one more prompt.
In the nullplatform UI, open Insights, click + New Dashboard, and describe the dashboard to the AI Builder:
Create a dashboard to track Kubernetes cost and right-sizing. I want
KPIs for the fleet's cost today, waste today, open right-sizing items,
and their estimated monthly savings, charts breaking daily cost down
by account and namespace, and the full list of right-sizing items in
the "FinOps" category with their savings and links.
The AI Builder generates the dashboard: summary KPIs on top, distribution charts below, and the full item list with links back to each application.
Save it and publish it with organization visibility. It updates in real time as the tracker prices each day and the scanner opens and closes items, so the program's impact is always one click away, for anyone.
✅ Checkpoint
The dashboard shows your fleet's cost and open right-sizing items, and applying a suggestion is reflected after the scope's next scan.
Make it yours
This suite is a starting point. The pieces most teams adjust first:
- Unit prices: the estimates you start with already make relative waste trustworthy. When you want real dollars, ask the skill for a monthly calibration workflow that derives the prices from your cloud bill, with guardrails against wild swings.
- Per-environment policy: the utilization ceilings, the platform floors, and the sizing basis (production on 10-minute peaks, development on averages) are all config entries.
- The deploy window:
DEPLOY_WINDOW_STARTandDEPLOY_WINDOW_ENDdecide when scheduled applies ship; the comment commands let anyone override a single deploy without touching config. - Q&A on the items: add an AI step that answers questions on item threads, grounded in the recorded numbers and the metrics tool, with a per-item reply cap.
- The pattern itself: measure, compare against a policy, suggest, apply idempotently. Swap the collector and the comparison and you have the same loop for storage classes, instance families, or idle development environments.
What you just built
How the nine workflows fit together
You now have a suite of nine workflows that share one folder and one configuration.
The cost model first, because everything builds on it: a scope's cost is what it reserves, not what it uses. Each hour bills max(usage, reserved), so a scope's cost drops when it lowers its requests, not when it idles. The gap between cost and usage cost is the waste that right-sizing removes.
Every night the Tracker fans out one Collect scope run per active K8s scope. The collector runs in your cluster through the nullplatform agent, prices the day from Prometheus, and upserts the scope's cost_tracking catalog instance: the day's numbers, rollups, and a compact 365-day series that outlives Prometheus retention.
Weekly, the Scanner fans out Analyze scope, cheapest check first: a prefilter on tracker data alone, then a deterministic per-pod filter with per-environment policy, and only then the AI step. Genuine findings become action items, with a one-click suggestion outside production (production items report only). Findings below the saving floor accumulate in one org-level portfolio item instead. Accepting a suggestion wakes Events, which hands off to Apply: patch for the next regular deploy, deploy now, or a night-window deploy steered from the item's comments.
Three different workflows close items, on purpose. Apply closes what it deployed itself. The weekly Closer fans out Verify scope: from tracker data alone it detects that the per-pod requests actually changed (applied or by hand), waits for three healthy days, then comments the realized saving and closes, flagging any scope the change left running hot. And the scanner closes findings that stopped being true. Nothing ever closes on missing data: an unmonitored scope is not a fixed one.
The analysis has exactly one AI step, and it's constrained: its only tool is the Metrics tool, another workflow of the suite, so every query the AI ran is an execution you can open and read:
ai_analysis:
  type: module
  plugin_type: claude-code-agent
  config:
    tools:
      # The tool is ITSELF a workflow: a bounded PromQL query_range
      # that runs on the cluster via the np agent.
      - type: workflow
        workflow: cost_metrics_tool
        name: query_metrics
The prompt forces an evidence protocol (peaks, coverage, throttling, every number citing its query), and the verdict still has to pass deterministic gates afterwards. Every step that prices, decides, or writes something is deterministic code.
The side benefit is the catalog itself: each scope's cost_tracking instance is visible on the scope page and mirrored to the data lake, so anything can read it, from dashboards to other workflows:
{
  "cost_today": 4.31, "usage_cost_today": 1.02, "waste_today": 3.29,
  "cost_30d": 129.4, "cpu_utilization_pct": 23.7,
  "provisioning_status": "over_provisioned",
  "last_scan_note": "Open right-sizing item: ~58 USD/month reclaimable",
  "daily_series": [ { "d": "2026-07-30", "cost": 4.31, "cpu_mc_pk10m": 412 } ]
}
And nothing is hardcoded: the API key resolves from secrets, the prices and thresholds from variables. The same workflows run unchanged in any organization.
Building blocks used
| Block | Role in this suite |
|---|---|
| Cron and manual triggers | Daily pricing, weekly analysis and verification, on-demand runs with an NRN filter |
| Agent command node | Runs the collector and every PromQL query inside your cluster |
| Data lake query node | Finds the K8s-backed scopes to price and analyze |
| Code nodes | The pricing model, the deterministic filter, the deploy-window math |
| AI node | Validates a finding is genuine before anyone gets a ticket |
| Action item nodes | Items, suggestions, comments, and closing |
| Platform event trigger | Reacts to accepted suggestions and item comments |
| Sub-workflows | Per-scope fan-outs, the apply handoff, and the metrics tool the AI calls |
What's next
- Migrate deprecated Lambda runtimes: the same detect, suggest, apply loop driven by a catalog instead of live metrics
- AI nodes: what the deep-dive step can and can't take on