May
Welcome to our changelog! 🚀
Stay updated on the latest changes and improvements in nullplatform.
✨ Insights into your organization
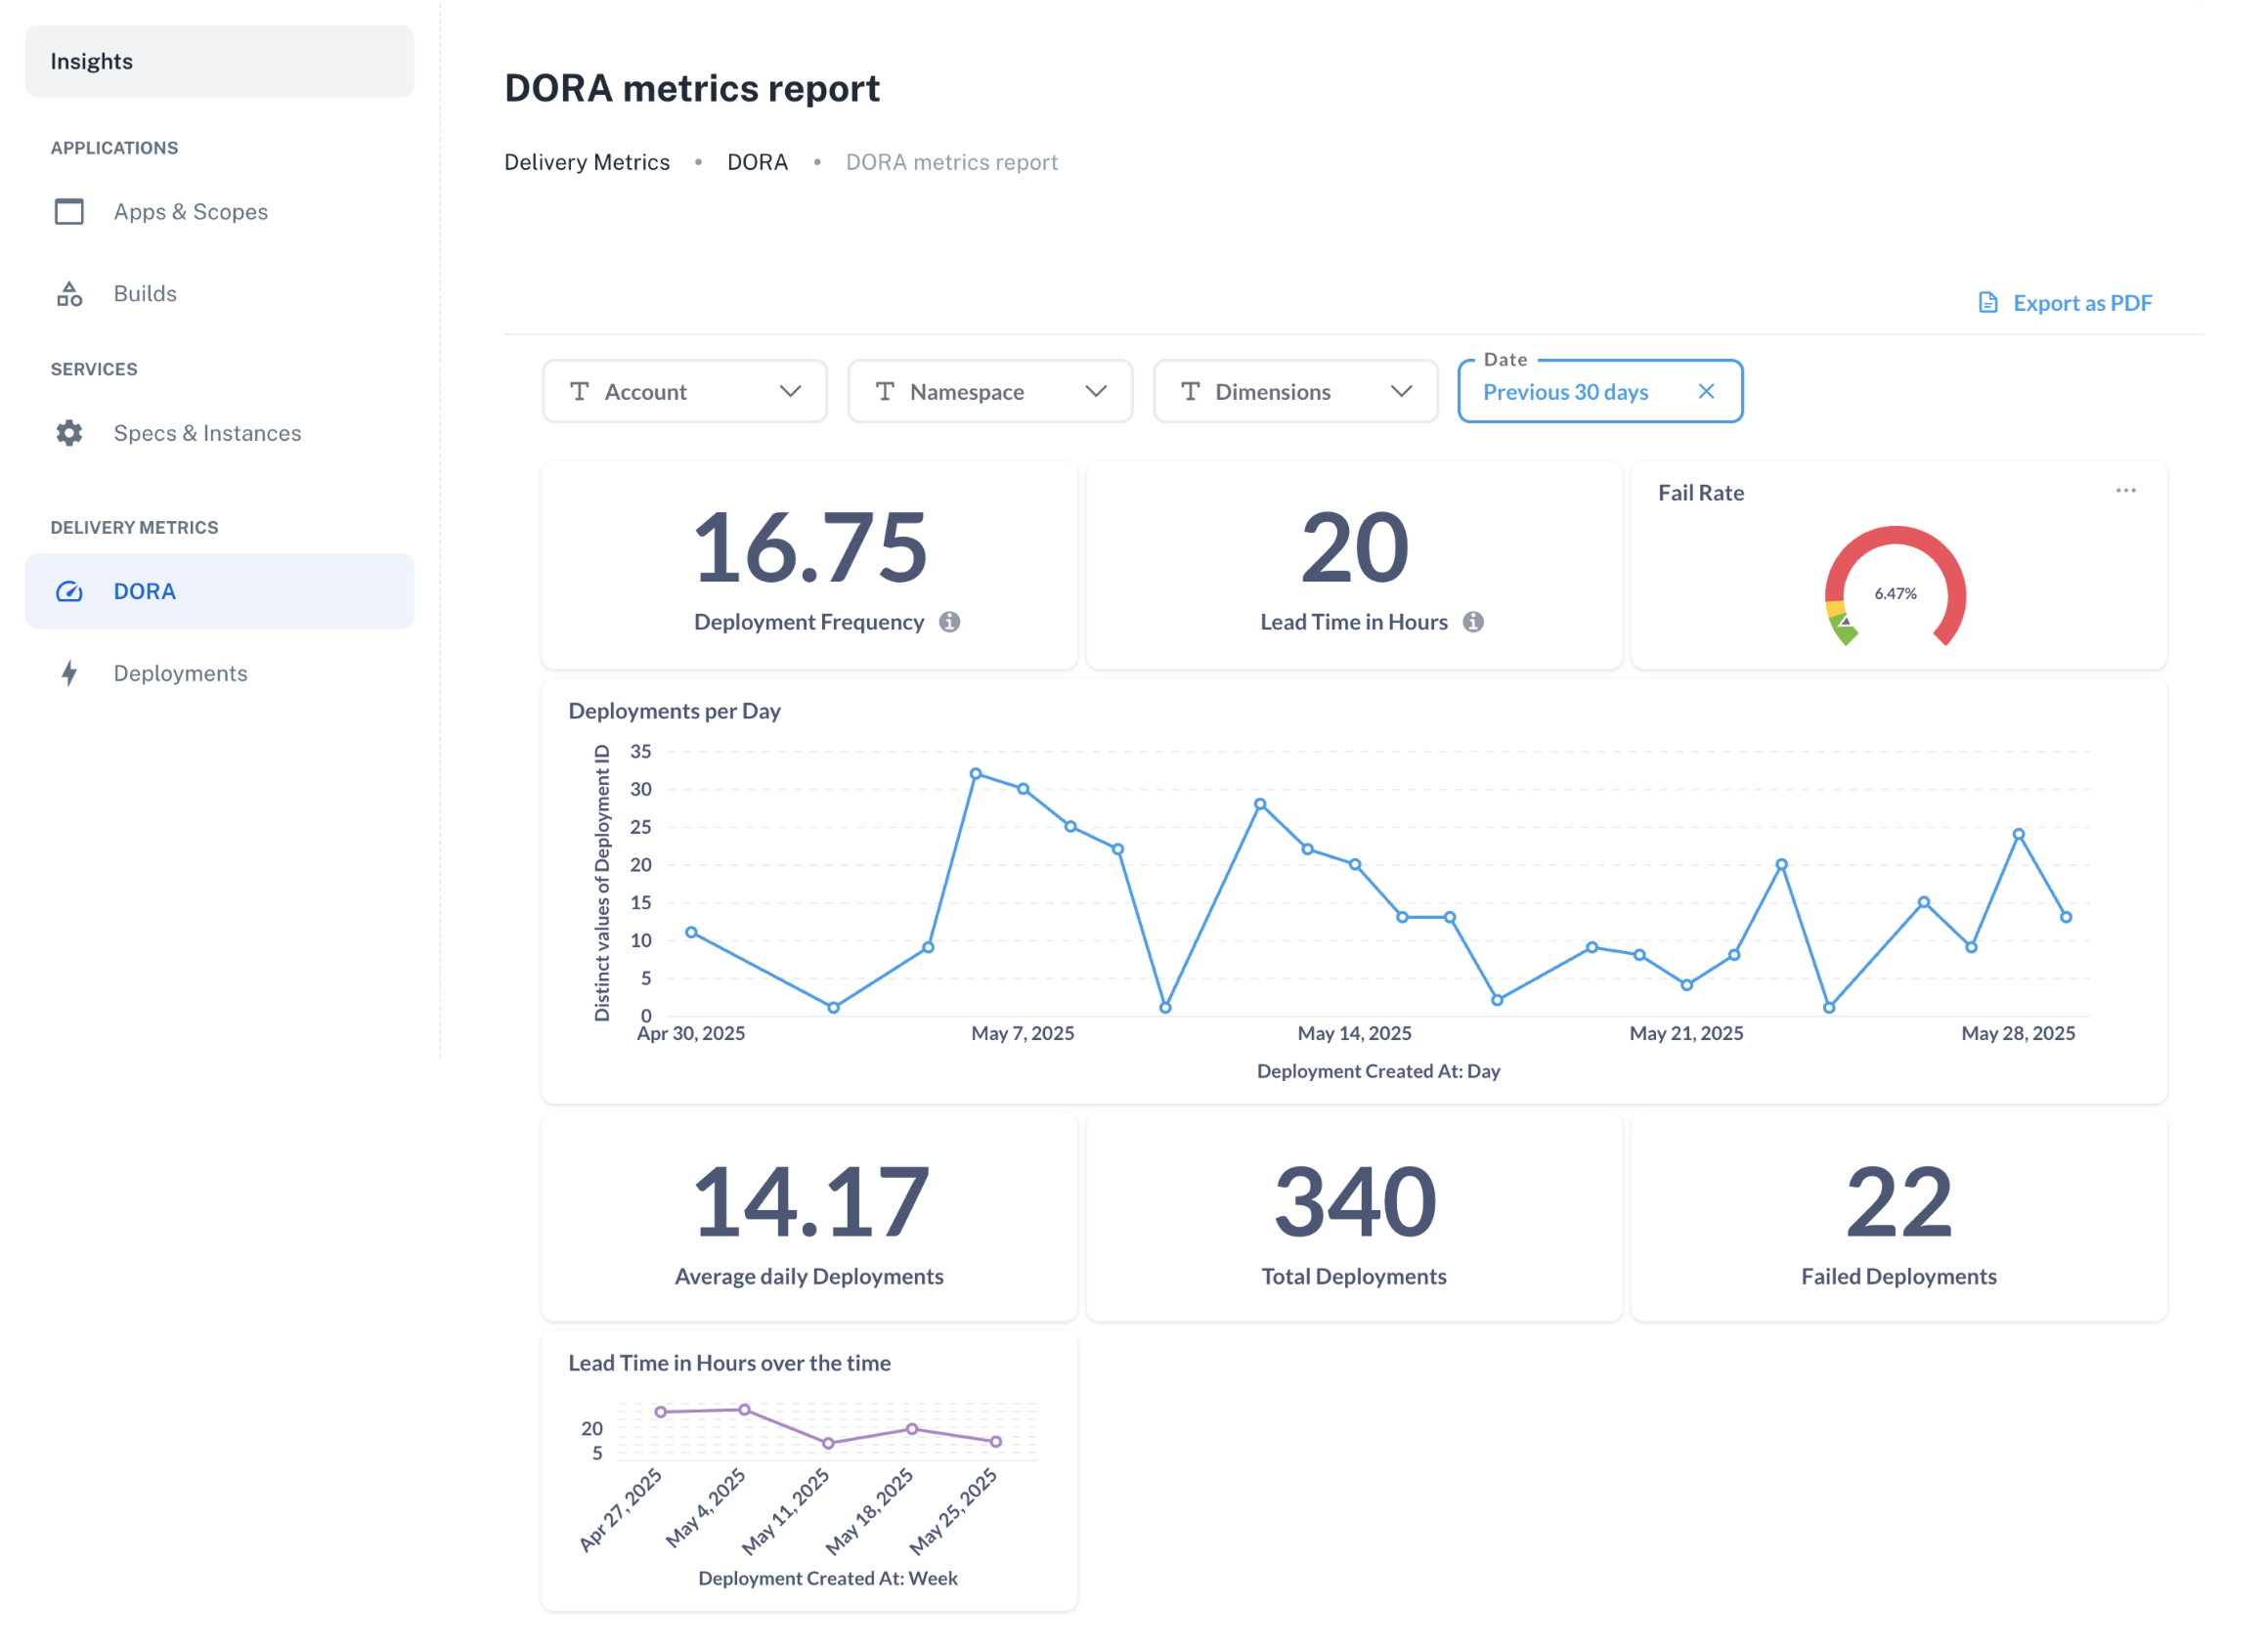
We’ve introduced the new Insights view—a central place to explore application activity and trends across your organization.
From deployment metrics to service usage, track key patterns and workflows in a single, consolidated view.
What you’ll find in Insights:
- DORA metrics to help you analyze deployment frequency, lead times, and success/failure rates.
- Application, scope, and build tracking to stay on top of development activity.
- Service visibility to understand usage, spot orphans, and monitor service health and activity.
👉 And this is just the beginning. If you're building your own insights or tracking additional metrics, let us know—we’d love to collaborate and explore how we can help.
✨ Introducing agent-backed scopes
We’re thrilled to introduce agent-backed scopes—a flexible way to craft your own scope implementation to deploy LLM agents, banking cores, mobile applications, static frontends, PL/SQL, or any technology you need. You can also use agent-backed scopes to tailor your Kubernetes deployment at the micro level.
Key highlights:
- Seamless UI experience: Agent-backed scopes behave just like traditional ones, with no extra learning curve for end users.
- Full feature compatibility: Use parameters, approvals, and policies just as with traditional scopes.
- Craft your own experience: Tailor creation and editing workflows to fit your specific requirements using our visual editor.
- Made for service crafters: as agent-backed scopes and services share many concepts and standards, service crafters will be coding their scopes right away.
👉 Learn how to create and use agent-backed scopes.
✨ Access to secret parameter values is now available
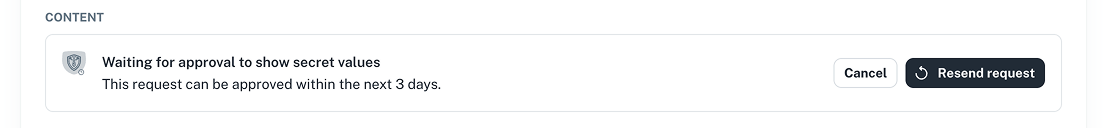
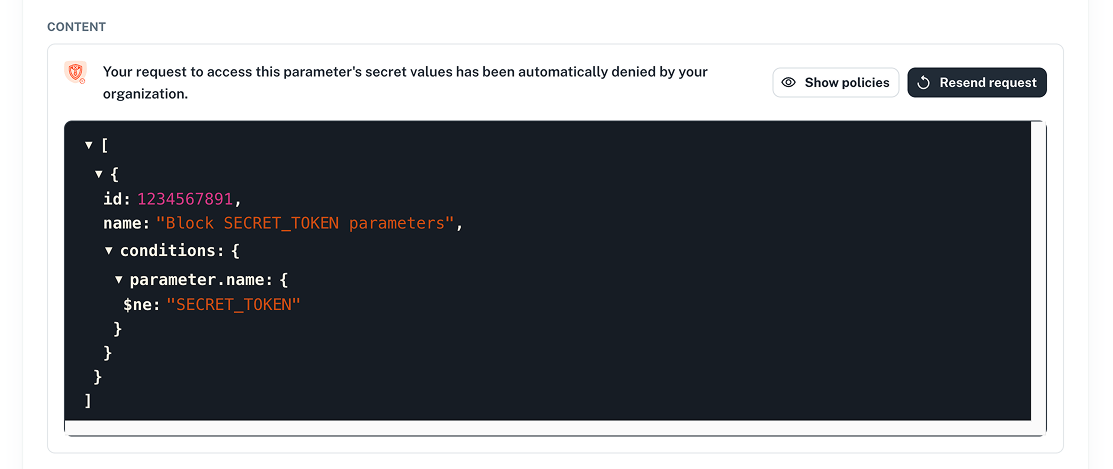
A long-awaited feature is here! You can now access the content of secret parameter values—while maintaining precise control over who gets access and when.
To view secret parameters, go to Development > Parameters, select a parameter for more details, and click Show secret values.
Here’s how it works:
-
Set up fine-grained approvals to validate each access request.
-
Define policies to automate approval grants or denials based on your rules.
-
And you can also rely on the SecOps role, which always retains access to secret values—when granted to the role.
👉 Learn more in our Parameters docs.
✨ Create SSO users before their first login
You can now create user accounts ahead of time, without waiting for users to log in for the first time.
This is ideal for teams that want to:
- Preconfigure roles and permissions
- Set up access in advance for onboarding
- Reduce the operational burden on security teams
How it works:
When creating a user, simply include the parameter "send_invite": false like this example:
- CLI
- cURL
np user create
  --body '{
  "email": "john.doe@email.com",
  "first_name": "John",
  "last_name": "Doe",
  "organization_id": 1234,
  "send_invite": false
}'
  curl -L -X POST 'https://api.nullplatform.com/user' \
  -H 'Content-Type: application/json' \
  -H 'Accept: application/json' \
  -H 'Authorization: Bearer <token>' \
  -d '{
    "email": "john.doe@email.com",
    "first_name": "John",
    "last_name": "Doe",
    "organization_id": 1234,
    "send_invite": false
  }'
This skips the invite step and registers the user immediately—allowing you to assign roles and configure access before they ever log in.
Once created, the user will appear in the system and can log in whenever they're ready.
👉 See our Users docs for more info.
✨ Platform settings: approvals and policies
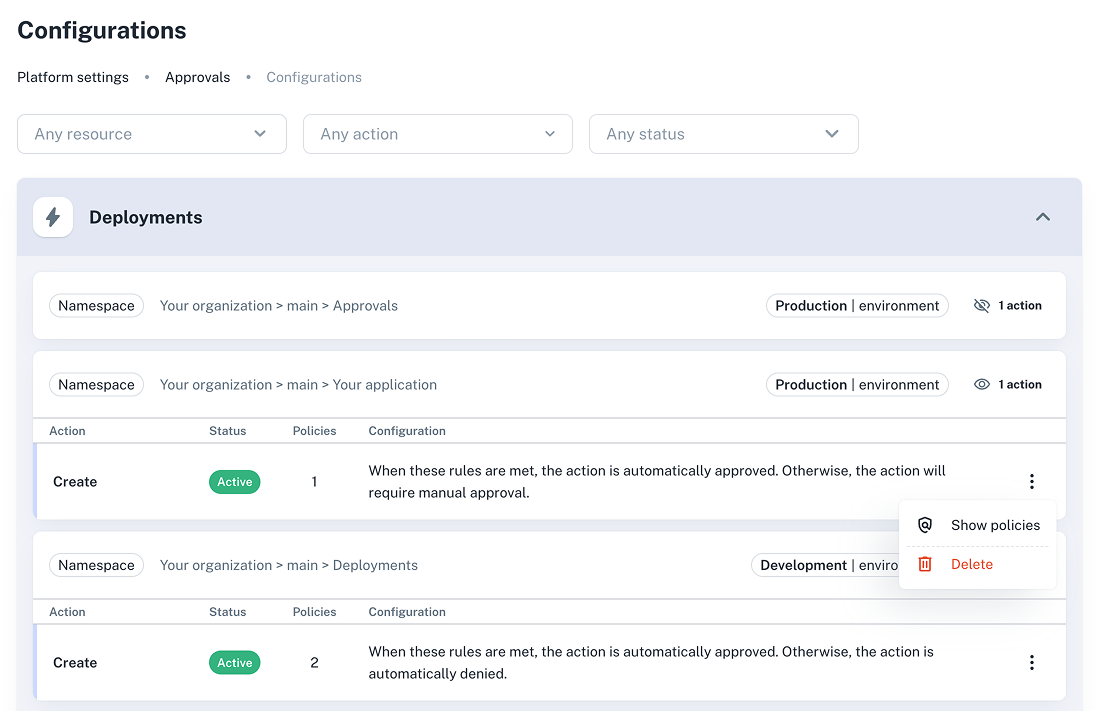
Take control of your workflows with a new UI for approvals and policies. View configurations and policies directly in the interface to ensure compliance and streamline governance.
You can now see in the UI:
- Approval actions: See which entities have approval actions and where they apply (by NRN).
- Action details: View type, status, and descriptions (e.g., “This action requires manual approval”).
- Policies: Review rules, such as:
Deployment must not have critical vulnerabilities:
{
  "build.metadata.security.critical": {
    "$lte": 0
  }
}
Coverage should be above 80% to allow deployments
{
  "build.metadata.coverage.percent": {
    "$gte": 80
  }
}
Go to Platform settings > Approvals > Configurations to see your organization's approval and policy setups.
👉 More info in our Approvals docs.
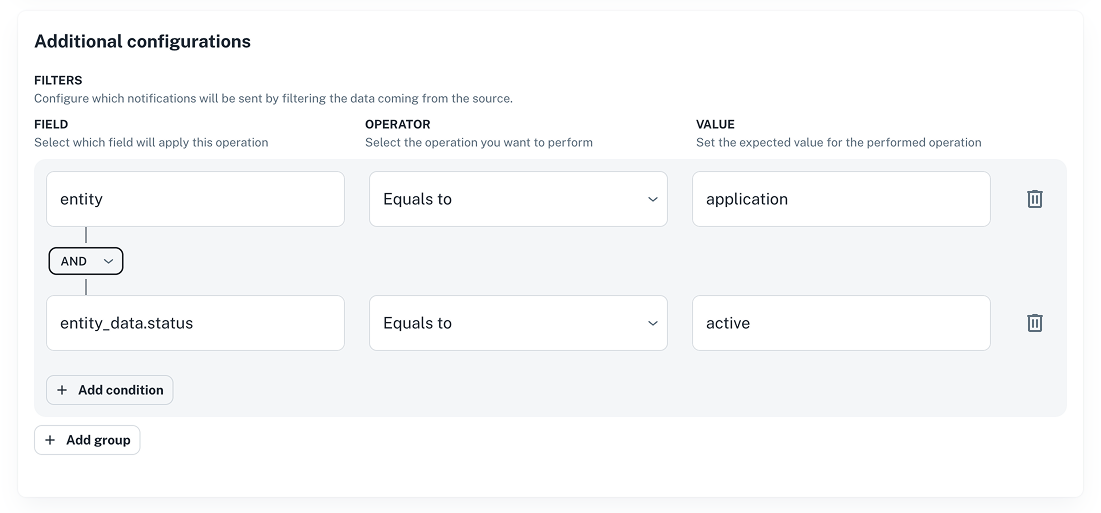
✨ Platform settings: improvements to channel creation
Last month we announced our new channel creation feature from the UI. This month, we’re enhancing it with advanced filter options.
What’s new:
- Select fields, operators, and values using dropdowns.
- Combine AND/OR conditions and group them as needed.
- Simplifies how notifications are filtered and sent to channels.
This greatly simplifies the way notifications are sent to a channel.
To get started, go to Platform settings > Notifications > Channels and click + New channel, or edit an existing one.
👉 Check our Filters docs for usage examples.
Example: Setting filters for when an application is created successfully
✨ We're updating how services are deleted
We’ve changed how service deletion works to help you avoid orphaned infrastructure and unnecessary costs.
What’s new:
- If a service has a
deleteaction, that action must be executed before deletion. - Alternatively, deletion can be forced with a specific parameter (
force=true).
Trying to delete a service without executing the delete action now results in an error unless the override is used.
Here's an example:
- CLI
- cURL
np link delete --id <LINK_ID> --force true
  curl -X DELETE 'https://api.nullplatform.com/link/<LINK_ID>?force=true' \
  -H 'Authorization: Bearer <token>'
👉 For more info, see our API reference docs.
✨ Compare services across environments
You can now compare service configurations across environments—like development, staging, and production—to catch and resolve discrepancies before they cause trouble.
How it works:
- Select a source and target service to compare.
- Get a structured
diffshowing what’s been added, removed, changed, or moved.
The payload will look something like this:
{
  "diff": [
    {
      "op": "replace",
      "path": "/dimensions/environment",
      "value": "staging"
    }
  ]
  "source": {...},    // The source service instance
  "target": {...}    // The target service instance
}
This feature helps you:
- Spot differences between service instances
- Promote changes with confidence
- Keep environments aligned
👉 Learn how to compare services in our docs.
✨ Latest updates to our CLI
We’ve added several improvements to the nullplatform CLI for a smoother experience:
- New commands: manage users (
np user) and providers (np providerandnp category). - Agent-backed scopes workflow: Simplify scope definition with (
np service workflow). - Compare services via CLI: A new command allows you to compare two services directly from the CLI (
np service compare). - Pagination support: Use
offsetandlimitflags forlistcommands. - Filtering scopes: Scope lists now support
typeandstatusfilters (np scope list). - Consistency updates: Replaced
updatecommands withpatchfor entity updates. - Support for new asset type: You can now manage assets of type
bundle. - Improved NRN reads: Use a new parameter to control how arrays are merged when reading NRNs.
- Force service deletion: override deletion safeguards (
--force true). See above for more info. - Bug fix: The
updatecommand for action specifications now includes the missingserviceSpecificationIdfield. - Deprecation notice:
-specificationcommands (e.g.,service-specification) will migrate to subcommands likenp service specification. Both formats will work temporarily.
You can install the latest version of the CLI using this command:
curl https://cli.nullplatform.com/install.sh | sh
👉 See our CLI docs for more info.
✨ NewRelic logging support for AWS EC2
We now support NewRelic for logging in AWS EC2 environments.
How to set it up:
- Go to Platform settings > Logging.
- Click + New configuration and select the provider.
- Fill in the required configuration details.
- Click Create configuration to save your setup.
👉 For more info, see our Supported integrations docs.
✨ Adjust ingress manifest with object modifiers
You can now use object modifiers to adjust your ingress manifests with greater flexibility.
Key benefits:
- Dynamic configuration – Automatically adjust manifests to your context
- Reusable patterns – Define once, apply across environments
- Context-aware replacements – Inject runtime variables on the fly
Wishing you a fantastic month ahead – from the nullplatform team! ❤️