Deployment strategies
What is a deployment strategy?
A deployment strategy defines how your application releases move through different environments. It controls traffic switching and metric-based rollback conditions.
Selecting a strategy for a new deployment
As a developer deploying an application, you can select one of the available strategies for your next deployment directly on the New Deployment view.
Here's an example:
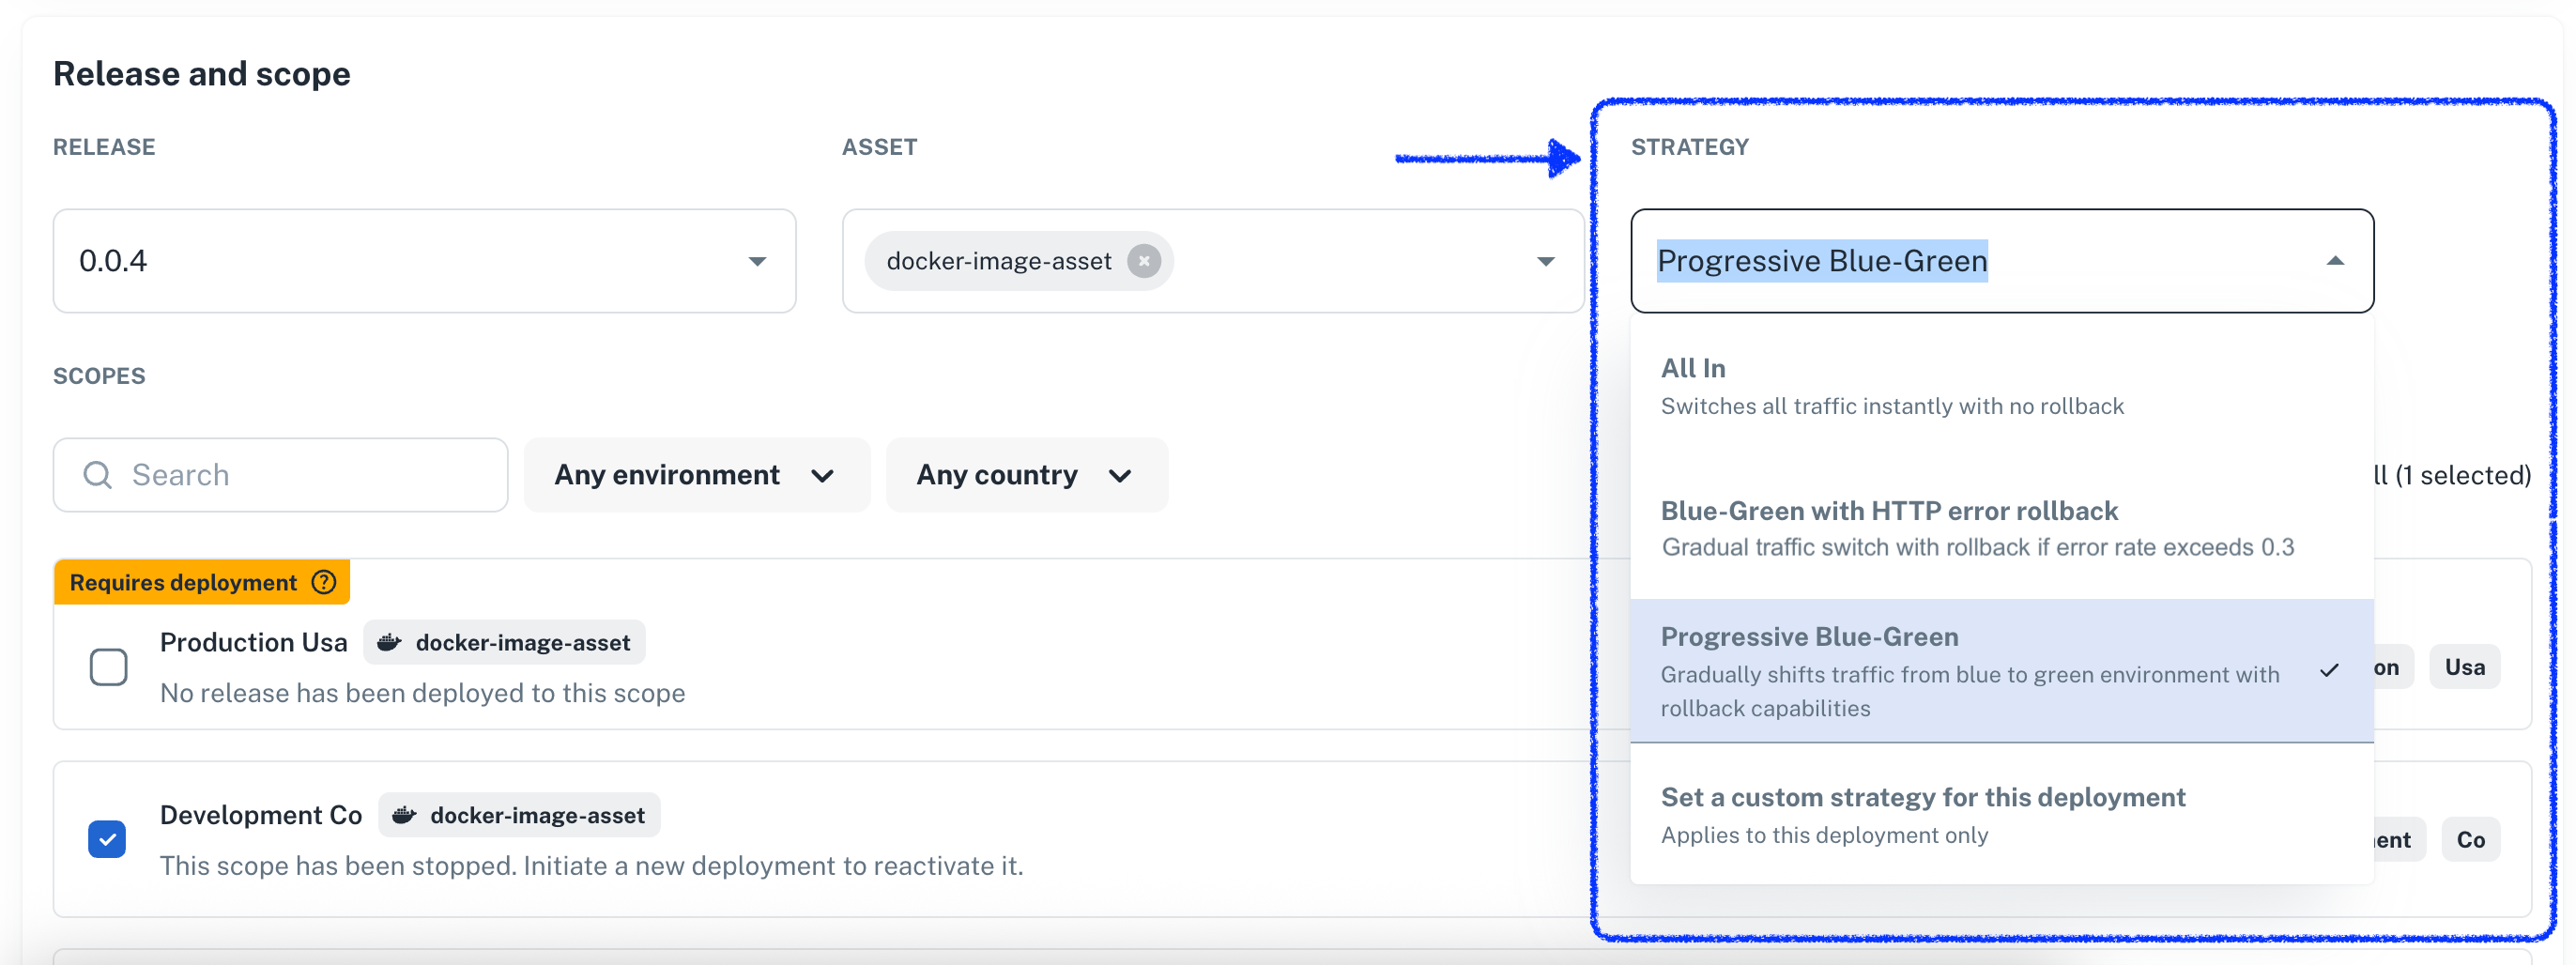
Strategies target specific scope types when the underlying technology supports them. For example, you cannot perform a blue-green deployment on a scope that's targeting a PL/SQL script on a database.
Single-shot customizations
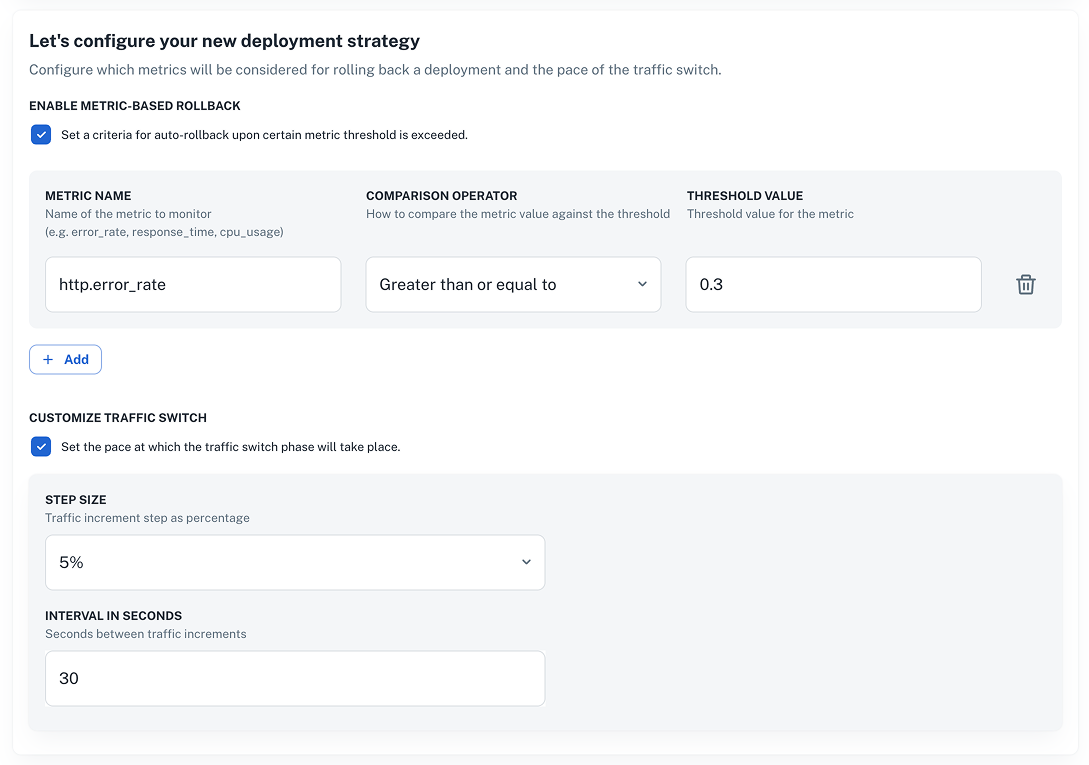
You can fine-tune a strategy before deploying using the Set a custom strategy for this deployment option.
For a blue-green deployment, this option allows you to:
- Toggle metric-based rollback on or off
- Adjust traffic distribution timing and increments
This is a one-off use. The underlying strategy stays the same, so you'll need to customize it again for future deployments.
Crafting new deployment strategies
Nullplatform lets you extend the base behavior by implementing your own deployment strategies.
In the following subsections, we'll dig into how you can create your own strategy, either from examples or from scratch.
When creating a strategy, note that:
- You can make it available only to certain resources (e.g., specific namespaces) and dimensions (e.g., development).
- It must be compatible with the targeted scope types.
Using the web interface
- Navigate to Platform Settings > Deployment Strategies
- Click + New deployment strategy
- Configure your targeting rules, traffic distribution, and rollback conditions
- Save the strategy to use across compatible scopes
Using the API
Create a strategy by sending a POST request to the deployment strategy endpoint with your configuration:
POST /deployment_strategy
{
  "name": "Critical deployment strategy",
  "description": "Strategy for critical deployments",
  "nrn": "organization=1:account=2:namespace=3:application=4",
  "dimensions": { "environment": "staging" },
  "parameters": {...} // see the sections below on how this field must be set,
  "scope_type_ids": ["12345", "67890"]
}
The parameters field
A strategy typically requires parameters, such as a maximum error rate for automatic rollback, that influence how the
deployment process operates. These parameters are specified (both JSON schema and UI schema) just as you would for
services using the parameters field.
Here's an example of how the parameters field works:
{
  "parameters": {
    // This has to be a JSON schema
    "type": "object",
    "properties": {
      "traffic_switch_step_size": {
        "type": "integer"
      },
      "maximum_error_rate": {
        "type": "integer"
      }
    },
    "required": [
      "traffic_switch_step_size",
      "maximum_error_rate"
    ],
    // Optional: tune how the properties are presented to the user on the UI
    "uiSchema": {
      // Works in the same way as it does for services, learn more here:
      // https://docs.nullplatform.io/docs/json-ui-schema/overview#json-ui-schema
    }
  }
}
Customizing traffic switch and metric-based rollbacks
Since nullplatform implements these capabilities directly, a strategy that supports these features must require a specific set of parameters expected by the deployment process.
JSON schema example
{
  "type": "object",
  "title": "Deployment strategy parameters",
  "uiSchema": {
    "type": "VerticalLayout",
    "elements": [
      {
        "type": "Control",
        "scope": "#/properties/metrics/properties/enabled",
        "label": "Enable metric-based rollback"
      },
      {
        "type": "Control",
        "scope": "#/properties/metrics/properties/rules",
        "label": "",
        "options": {
          "style": {
            "p": 2,
            "bgcolor": "background.surface",
            "borderRadius": ".5rem",
            "& .MuiInputBase-input": {
              "bgcolor": "background.paper",
              "borderRadius": ".5rem"
            },
            "& .MuiOutlinedInput-root": {
              "bgcolor": "background.paper",
              "borderRadius": ".5rem"
            }
          }
        },
        "rule": {
          "effect": "SHOW",
          "condition": {
            "scope": "#/properties/metrics/properties/enabled",
            "schema": {
              "const": true
            }
          }
        }
      },
      {
        "type": "Control",
        "scope": "#/properties/traffic/properties/enable_auto_switch",
        "label": "Customize traffic switch"
      },
      {
        "type": "Group",
        "rule": {
          "effect": "SHOW",
          "condition": {
            "scope": "#/properties/traffic/properties/enable_auto_switch",
            "schema": {
              "const": true
            }
          }
        },
        "options": {
          "style": {
            "bgcolor": "background.surface",
            "borderRadius": ".em",
            "& .MuiInputBase-input": {
              "bgcolor": "background.paper"
            },
            "& .MuiOutlinedInput-root": {
              "bgcolor": "background.paper"
            }
          }
        },
        "elements": [
          {
            "type": "Control",
            "scope": "#/properties/traffic/properties/step",
            "label": "Step size",
            "rule": {
              "effect": "SHOW",
              "condition": {
                "scope": "#/properties/traffic/properties/enable_auto_switch",
                "schema": {
                  "const": true
                }
              }
            }
          },
          {
            "type": "Control",
            "scope": "#/properties/traffic/properties/interval",
            "label": "Interval in seconds",
            "rule": {
              "effect": "SHOW",
              "condition": {
                "scope": "#/properties/traffic/properties/enable_auto_switch",
                "schema": {
                  "const": true
                }
              }
            }
          }
        ]
      }
    ]
  },
  "properties": {
    "metrics": {
      "type": "object",
      "title": "Metrics configuration",
      "description": "Configure metrics monitoring for deployment validation",
      "default": {
        "enabled": false,
        "rules": []
      },
      "properties": {
        "enabled": {
          "type": "boolean",
          "title": "Enable metric-based rollback",
          "description": "Set a criteria for auto-rollback upon certain metric threshold is exceeded.",
          "default": false
        },
        "rules": {
          "type": "array",
          "default": [],
          "items": {
            "type": "object",
            "title": "Metric rule",
            "properties": {
              "name": {
                "type": "string",
                "title": "Metric name",
                "description": "Name of the metric to monitor",
                "examples": [
                  "error_rate",
                  "response_time",
                  "cpu_usage"
                ]
              },
              "operator": {
                "type": "string",
                "title": "Comparison operator",
                "description": "How to compare the metric value against the threshold",
                "oneOf": [
                  {
                    "const": "greater_than",
                    "title": "Greater than or equal to"
                  },
                  {
                    "const": "less_than",
                    "title": "Less than or equal to"
                  },
                  {
                    "const": "equals",
                    "title": "Equals to"
                  }
                ],
                "default": "equals"
              },
              "threshold": {
                "type": "number",
                "title": "Threshold value",
                "description": "Threshold value for the metric",
                "placeholder": "eg., 10"
              }
            }
          }
        }
      },
      "if": {
        "properties": {
          "enabled": {
            "const": true
          }
        }
      },
      "then": {
        "properties": {
          "rules": {
            "minItems": 1,
            "items": {
              "properties": {
                "name": {
                  "minLength": 2
                },
                "threshold": {
                  "minimum": 0
                }
              },
              "required": [
                "name",
                "threshold",
                "operator"
              ]
            }
          }
        }
      }
    },
    "traffic": {
      "type": "object",
      "title": "Traffic management",
      "description": "Configure traffic switching behavior",
      "default": {
        "enable_auto_switch": false,
        "interval": 10,
        "step": 0.1
      },
      "properties": {
        "enable_auto_switch": {
          "type": "boolean",
          "title": "Customize traffic switch",
          "description": "Set the pace at which the traffic switch phase will take place.",
          "default": false
        },
        "interval": {
          "type": "integer",
          "title": "Interval in seconds",
          "description": "Seconds between traffic increments",
          "default": 10
        },
        "step": {
          "title": "Step size",
          "description": "Traffic increment step as percentage",
          "oneOf": [
            {
              "const": 0.05,
              "title": "5%"
            },
            {
              "const": 0.1,
              "title": "10%"
            },
            {
              "const": 0.15,
              "title": "15%"
            },
            {
              "const": 0.2,
              "title": "20%"
            },
            {
              "const": 0.25,
              "title": "25%"
            },
            {
              "const": 0.3,
              "title": "30%"
            },
            {
              "const": 0.35,
              "title": "35%"
            },
            {
              "const": 0.4,
              "title": "40%"
            },
            {
              "const": 0.45,
              "title": "45%"
            },
            {
              "const": 0.5,
              "title": "50%"
            },
            {
              "const": 1,
              "title": "100%"
            }
          ],
          "default": 0.1
        }
      },
      "if": {
        "properties": {
          "enable_auto_switch": {
            "const": true
          }
        }
      },
      "then": {
        "required": [
          "interval",
          "step"
        ],
        "properties": {
          "interval": {
            "minimum": 1,
            "maximum": 120
          }
        }
      }
    }
  }
}
Targeting nullplatform-defined scopes
Nullplatform owns the definitions for a set of scopes: AWS Serverless, K8s (legacy, not agent-backed), and AWS EC2.
If you want to target those scopes, use these scope_type_ids:
| Scope Type | Scope ID |
|---|---|
| AWS EC2 | 1513685250 |
| Kubernetes (legacy / non agent-backed) | 1517814019 |
| Serverless (AWS Lambda) | 1509622017 |
Use policies to govern which strategies are available
You can specify which strategies are available by resource (e.g., namespace) or dimensions (e.g., production). This is done through policies. Reach out if you'd like help setting this up.
Examples: blue-green and all-in strategies
In this section, we present two fully working, real-world examples you can apply directly using the API.
Blue-Green with automatic rollback
This strategy gradually shifts traffic from the old version to the new one, automatically rolling back if error rates exceed your threshold (e.g., HTTP error rate > 0.3).
Best for:
- Production deployments requiring safety nets
- Applications that can run two instances of the code simultaneously
- Scenarios where you want specific rollback triggers
Alternatively, send a POST request to the Create deployment strategy endpoint like the example below.
Note: Don't forget to set your
nrnanddimensionsvalues before sending the request.
Blue-Green strategy request example
curl -L 'https://api.nullplatform.com/deployment_strategy' \
-H 'Content-Type: application/json' \
-H 'Accept: application/json' \
-H 'Authorization: Bearer <token>' \
-d '{
    "name": "Blue-Green with HTTP error rollback",
    "description": "Gradual traffic shift with rollback if error rate exceeds 0.3",
    "nrn": "<your-nrn>",
    "dimensions": {
      "<key-value>"
    },
    "scope_type_ids": [],
    "parameters": {
      "type": "object",
      "title": "Deployment strategy parameters",
      "uiSchema": {
        "type": "VerticalLayout",
        "elements": [
          {
            "type": "Control",
            "scope": "#/properties/metrics/properties/enabled",
            "label": "Enable metric-based rollback"
          },
          {
            "type": "Control",
            "scope": "#/properties/metrics/properties/rules",
            "label": "",
            "options": {
              "style": {
                "p": 2,
                "bgcolor": "background.surface",
                "borderRadius": ".5rem",
                "& .MuiInputBase-input": {
                  "bgcolor": "background.paper",
                  "borderRadius": ".5rem"
                },
                "& .MuiOutlinedInput-root": {
                  "bgcolor": "background.paper",
                  "borderRadius": ".5rem"
                }
              }
            },
            "rule": {
              "effect": "SHOW",
              "condition": {
                "scope": "#/properties/metrics/properties/enabled",
                "schema": {
                  "const": true
                }
              }
            }
          },
          {
            "type": "Control",
            "scope": "#/properties/traffic/properties/enable_auto_switch",
            "label": "Customize traffic switch"
          },
          {
            "type": "Group",
            "rule": {
              "effect": "SHOW",
              "condition": {
                "scope": "#/properties/traffic/properties/enable_auto_switch",
                "schema": {
                  "const": true
                }
              }
            },
            "options": {
              "style": {
                "bgcolor": "background.surface",
                "borderRadius": ".em",
                "& .MuiInputBase-input": {
                  "bgcolor": "background.paper"
                },
                "& .MuiOutlinedInput-root": {
                  "bgcolor": "background.paper"
                }
              }
            },
            "elements": [
              {
                "type": "Control",
                "scope": "#/properties/traffic/properties/step",
                "label": "Step size",
                "rule": {
                  "effect": "SHOW",
                  "condition": {
                    "scope": "#/properties/traffic/properties/enable_auto_switch",
                    "schema": {
                      "const": true
                    }
                  }
                }
              },
              {
                "type": "Control",
                "scope": "#/properties/traffic/properties/interval",
                "label": "Interval in seconds",
                "rule": {
                  "effect": "SHOW",
                  "condition": {
                    "scope": "#/properties/traffic/properties/enable_auto_switch",
                    "schema": {
                      "const": true
                    }
                  }
                }
              }
            ]
          }
        ]
      },
      "properties": {
        "metrics": {
          "type": "object",
          "title": "Metrics configuration",
          "description": "Configure metrics monitoring for deployment validation",
          "default": {
            "enabled": true,
            "rules": [
              {
                "operator": "greater_than",
                "name": "http.error_rate",
                "threshold": 0.3
              }
            ]
          },
          "properties": {
            "enabled": {
              "type": "boolean",
              "title": "Enable metric-based rollback",
              "description": "Set a criteria for auto-rollback upon certain metric threshold is exceeded.",
              "default": true
            },
            "rules": {
              "type": "array",
              "items": {
                "type": "object",
                "title": "Metric rule",
                "properties": {
                  "name": {
                    "type": "string",
                    "title": "Metric name",
                    "description": "Name of the metric to monitor",
                    "examples": [
                      "error_rate",
                      "response_time",
                      "cpu_usage"
                    ]
                  },
                  "operator": {
                    "type": "string",
                    "title": "Comparison operator",
                    "description": "How to compare the metric value against the threshold",
                    "oneOf": [
                      { "const": "greater_than", "title": "Greater than or equal to" },
                      { "const": "less_than", "title": "Less than or equal to" },
                      { "const": "equals", "title": "Equals to" }
                    ],
                    "default": "equals"
                  },
                  "threshold": {
                    "type": "number",
                    "title": "Threshold value",
                    "description": "Threshold value for the metric",
                    "placeholder": "eg., 10"
                  }
                }
              },
              "default": [
                {
                  "operator": "greater_than",
                  "name": "http.error_rate",
                  "threshold": 0.3
                }
              ]
            }
          },
          "if": {
            "properties": {
              "enabled": {
                "const": true
              }
            }
          },
          "then": {
            "properties": {
              "rules": {
                "minItems": 1,
                "items": {
                  "properties": {
                    "name": { "minLength": 2 },
                    "threshold": { "minimum": 0 }
                  },
                  "required": ["name", "threshold", "operator"]
                }
              }
            }
          }
        },
        "traffic": {
          "type": "object",
          "title": "Traffic management",
          "description": "Configure traffic switching behavior",
          "default": {
            "enable_auto_switch": true,
            "interval": 30,
            "step": 0.1
          },
          "properties": {
            "enable_auto_switch": {
              "type": "boolean",
              "title": "Customize traffic switch",
              "description": "Set the pace at which the traffic switch phase will take place.",
              "default": true
            },
            "interval": {
              "type": "integer",
              "title": "Interval in seconds",
              "description": "Seconds between traffic increments",
              "default": 30
            },
            "step": {
              "title": "Step size",
              "description": "Traffic increment step as percentage",
              "oneOf": [
                { "const": 0.05, "title": "5%" },
                { "const": 0.1,  "title": "10%" },
                { "const": 0.15, "title": "15%" },
                { "const": 0.2,  "title": "20%" },
                { "const": 0.25, "title": "25%" },
                { "const": 0.3,  "title": "30%" },
                { "const": 0.35, "title": "35%" },
                { "const": 0.4,  "title": "40%" },
                { "const": 0.45, "title": "45%" },
                { "const": 0.5,  "title": "50%" },
                { "const": 1,    "title": "100%" }
              ],
              "default": 0.1
            }
          },
          "if": {
            "properties": {
              "enable_auto_switch": { "const": true }
            }
          },
          "then": {
            "required": ["interval", "step"],
            "properties": {
              "interval": { "minimum": 1, "maximum": 120 }
            }
          }
        }
      }
    },
    "type": "deployment"
  }'
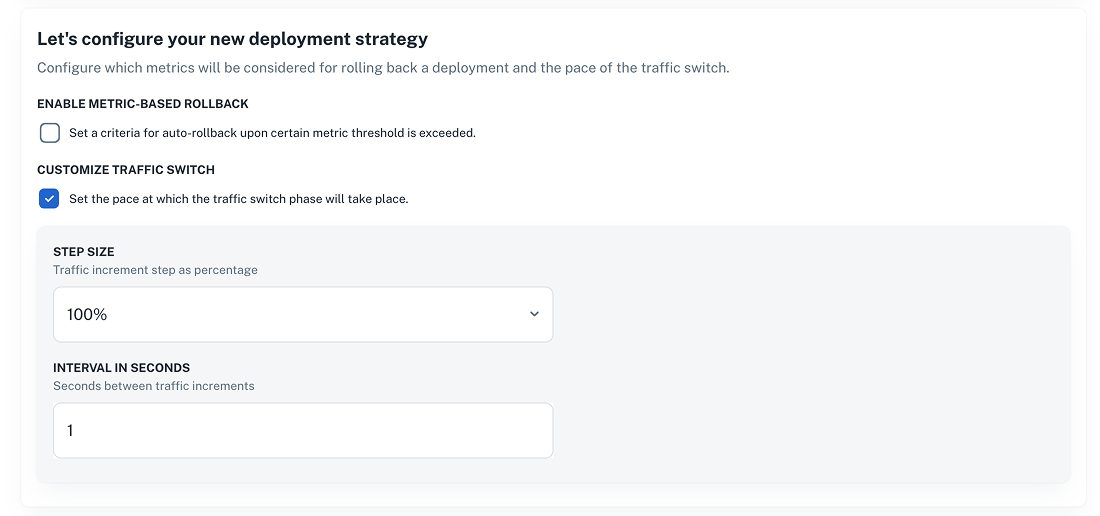
All-In strategy
This strategy instantly switches all traffic to the new version without gradual rollout or automatic rollback.
Best for:
- Urgent updates that need immediate effect
- Deployments where you can't have two versions of the application running
- Low environments (e.g., development) where agility is key
Alternatively, send a POST request to the Create deployment strategy endpoint like the example below.
Note: Don't forget to set your
nrnanddimensionsvalues before sending the request.
All in request example
curl -L 'https://api.nullplatform.com/deployment_strategy' \
-H 'Content-Type: application/json' \
-H 'Accept: application/json' \
-H 'Authorization: Bearer <token>' \
-d '{
    "name": "All In",
    "description": "Switches all traffic instantly with no rollback",
    "nrn": "<your-nrn>",
    "dimensions": {
      "<key-value>"
    },
    "scope_type_ids": [],
    "parameters": {
      "type": "object",
      "title": "Deployment strategy parameters",
      "uiSchema": {
        "type": "VerticalLayout",
        "elements": [
          {
            "type": "Control",
            "scope": "#/properties/metrics/properties/enabled",
            "label": "Enable metric-based rollback"
          },
          {
            "type": "Control",
            "scope": "#/properties/metrics/properties/rules",
            "label": "",
            "options": {
              "style": {
                "p": 2,
                "bgcolor": "background.surface",
                "borderRadius": ".5rem",
                "& .MuiInputBase-input": {
                  "bgcolor": "background.paper",
                  "borderRadius": ".5rem"
                },
                "& .MuiOutlinedInput-root": {
                  "bgcolor": "background.paper",
                  "borderRadius": ".5rem"
                }
              }
            },
            "rule": {
              "effect": "SHOW",
              "condition": {
                "scope": "#/properties/metrics/properties/enabled",
                "schema": {
                  "const": true
                }
              }
            }
          },
          {
            "type": "Control",
            "scope": "#/properties/traffic/properties/enable_auto_switch",
            "label": "Customize traffic switch"
          },
          {
            "type": "Group",
            "rule": {
              "effect": "SHOW",
              "condition": {
                "scope": "#/properties/traffic/properties/enable_auto_switch",
                "schema": {
                  "const": true
                }
              }
            },
            "options": {
              "style": {
                "bgcolor": "background.surface",
                "borderRadius": ".em",
                "& .MuiInputBase-input": {
                  "bgcolor": "background.paper"
                },
                "& .MuiOutlinedInput-root": {
                  "bgcolor": "background.paper"
                }
              }
            },
            "elements": [
              {
                "type": "Control",
                "scope": "#/properties/traffic/properties/step",
                "label": "Step size",
                "rule": {
                  "effect": "SHOW",
                  "condition": {
                    "scope": "#/properties/traffic/properties/enable_auto_switch",
                    "schema": {
                      "const": true
                    }
                  }
                }
              },
              {
                "type": "Control",
                "scope": "#/properties/traffic/properties/interval",
                "label": "Interval in seconds",
                "rule": {
                  "effect": "SHOW",
                  "condition": {
                    "scope": "#/properties/traffic/properties/enable_auto_switch",
                    "schema": {
                      "const": true
                    }
                  }
                }
              }
            ]
          }
        ]
      },
      "properties": {
        "metrics": {
          "type": "object",
          "title": "Metrics configuration",
          "description": "Configure metrics monitoring for deployment validation",
          "default": {
            "enabled": false,
            "rules": []
          },
          "properties": {
            "enabled": {
              "type": "boolean",
              "title": "Enable metric-based rollback",
              "description": "Set a criteria for auto-rollback upon certain metric threshold is exceeded.",
              "default": false
            },
            "rules": {
              "type": "array",
              "items": {
                "type": "object",
                "title": "Metric rule",
                "properties": {
                  "name": {
                    "type": "string",
                    "title": "Metric name",
                    "description": "Name of the metric to monitor",
                    "examples": [
                      "error_rate",
                      "response_time",
                      "cpu_usage"
                    ]
                  },
                  "operator": {
                    "type": "string",
                    "title": "Comparison operator",
                    "description": "How to compare the metric value against the threshold",
                    "oneOf": [
                      { "const": "greater_than", "title": "Greater than or equal to" },
                      { "const": "less_than", "title": "Less than or equal to" },
                      { "const": "equals", "title": "Equals to" }
                    ],
                    "default": "equals"
                  },
                  "threshold": {
                    "type": "number",
                    "title": "Threshold value",
                    "description": "Threshold value for the metric",
                    "placeholder": "eg., 10"
                  }
                }
              },
              "default": []
            }
          },
          "if": {
            "properties": {
              "enabled": {
                "const": true
              }
            }
          },
          "then": {
            "properties": {
              "rules": {
                "minItems": 1,
                "items": {
                  "properties": {
                    "name": { "minLength": 2 },
                    "threshold": { "minimum": 0 }
                  },
                  "required": ["name", "threshold", "operator"]
                }
              }
            }
          }
        },
        "traffic": {
          "type": "object",
          "title": "Traffic management",
          "description": "Configure traffic switching behavior",
          "default": {
            "enable_auto_switch": true,
            "interval": 1,
            "step": 1
          },
          "properties": {
            "enable_auto_switch": {
              "type": "boolean",
              "title": "Customize traffic switch",
              "description": "Set the pace at which the traffic switch phase will take place.",
              "default": true
            },
            "interval": {
              "type": "integer",
              "title": "Interval in seconds",
              "description": "Seconds between traffic increments",
              "default": 1
            },
            "step": {
              "title": "Step size",
              "description": "Traffic increment step as percentage",
              "oneOf": [
                { "const": 0.05, "title": "5%" },
                { "const": 0.1,  "title": "10%" },
                { "const": 0.15, "title": "15%" },
                { "const": 0.2,  "title": "20%" },
                { "const": 0.25, "title": "25%" },
                { "const": 0.3,  "title": "30%" },
                { "const": 0.35, "title": "35%" },
                { "const": 0.4,  "title": "40%" },
                { "const": 0.45, "title": "45%" },
                { "const": 0.5,  "title": "50%" },
                { "const": 1,    "title": "100%" }
              ],
              "default": 1
            }
          },
          "if": {
            "properties": {
              "enable_auto_switch": { "const": true }
            }
          },
          "then": {
            "required": ["interval", "step"],
            "properties": {
              "interval": { "minimum": 1, "maximum": 120 }
            }
          }
        }
      }
    },
    "type": "deployment"
  }'