Configure a custom metrics provider for services
Extend nullplatform's observability by implementing custom metric providers for services. This guide shows how to configure your provider and channel for any backend, so performance metrics appear in the UI.
When to use this
Use a custom telemetry provider if nullplatform doesn't support your product (for example, Grafana) or if telemetry only exists in a private environment that nullplatform can't reach (for example, an Elasticsearch instance in your infrastructure).
To do this, you'll use the nullplatform agent, which lets you:
- Implement and run your own scripts to collect metrics from any provider.
- Keep those providers private, because the agent runs in your infrastructure and can access them without exposing them externally.
Prerequisites
You'll need the following before configuring a custom telemetry provider:
- The nullplatform agent installed and configured.
- An API key with the necessary permissions: agent, developer, and ops.
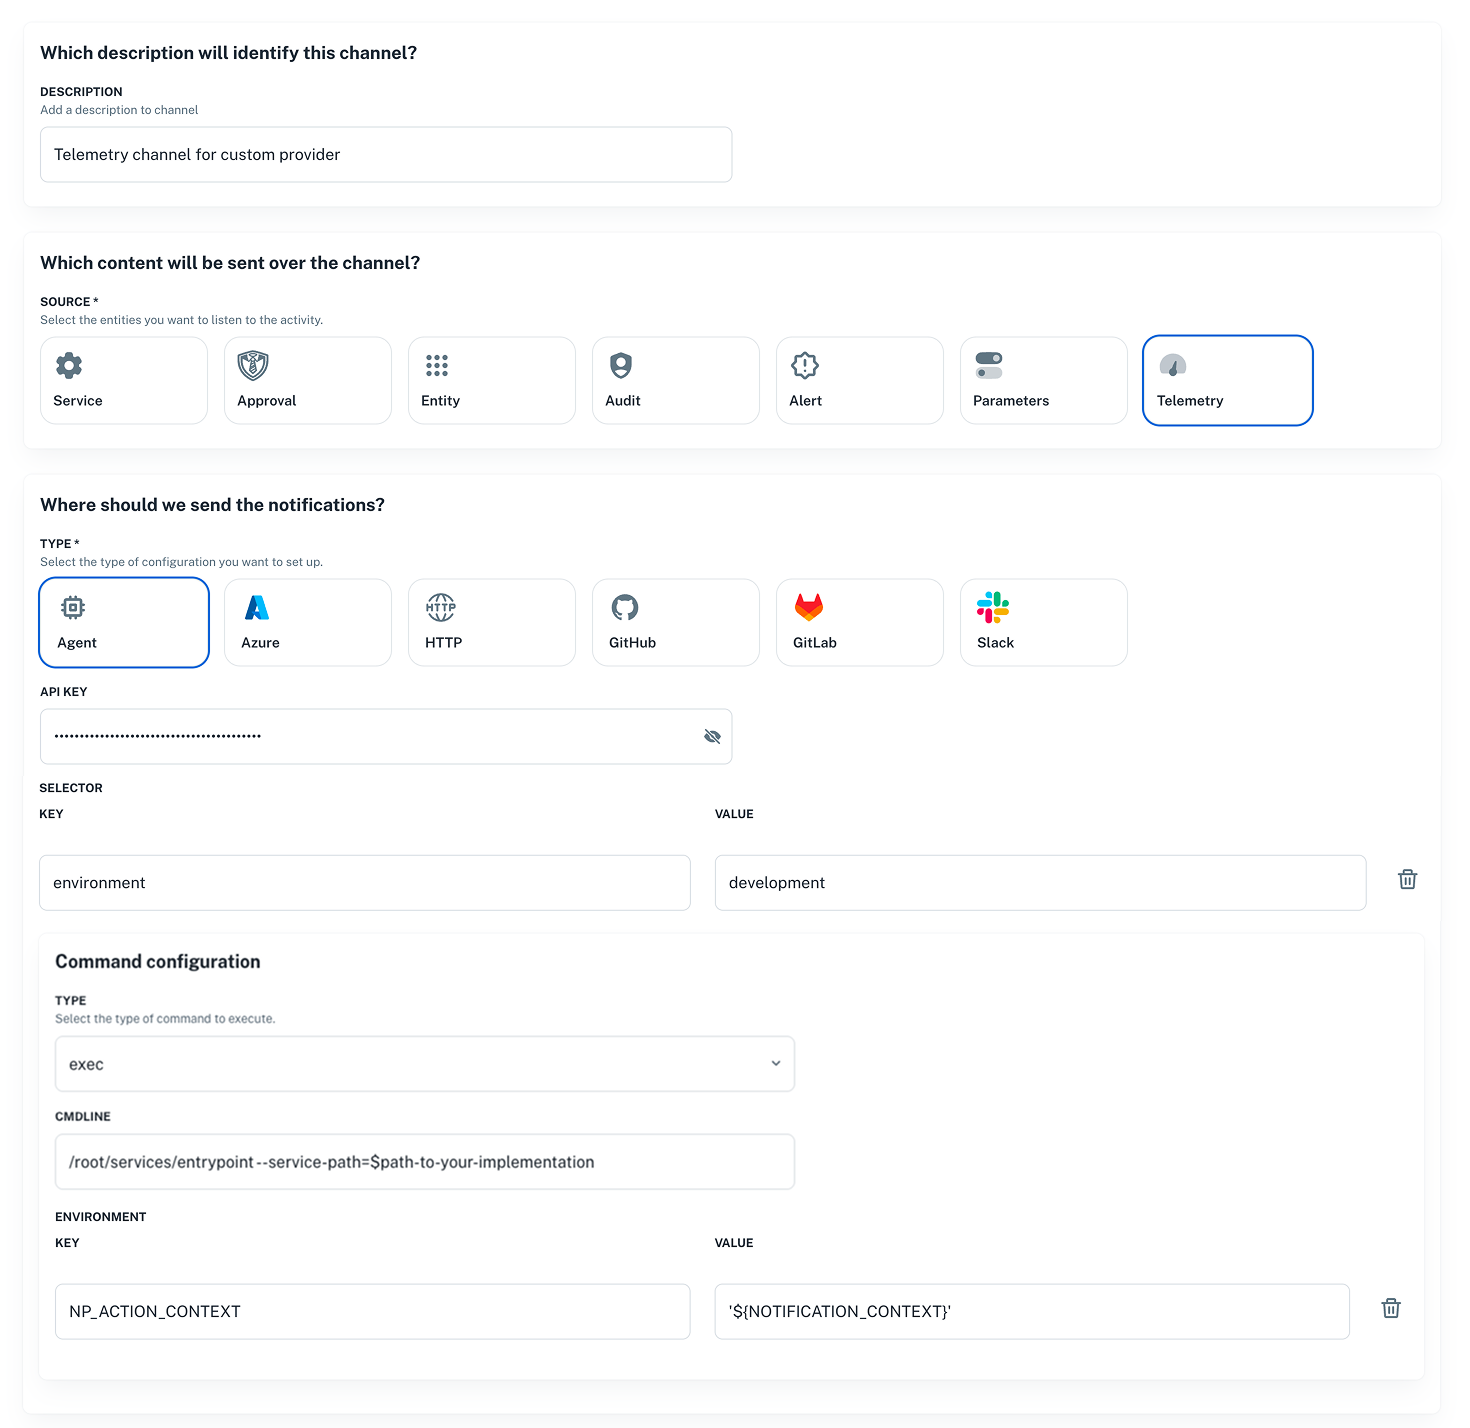
Configure the channel
To use a custom telemetry provider with nullplatform, you need to configure a notification channel with
"source": ["telemetry"], to tell nullplatform where and how to reach your provider.
This notification channel will:
- Consume "telemetry" notifications.
- Use the nullplatform agent as the execution runtime.
- Execute a script that points to your implementation.
- UI
- CLI
- cURL
Go to Platform settings > Notifications > Channels and click + New channel.
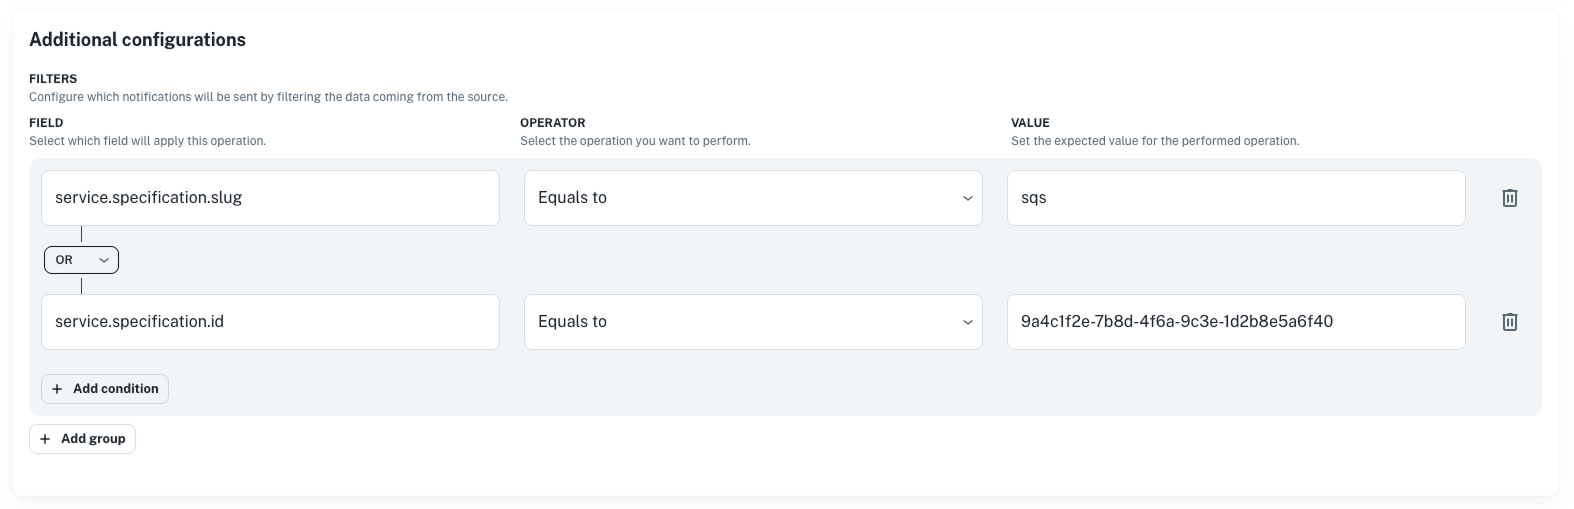
Define filters for the service
The filters you define in the channel must include a condition for service slug or service specification to ensure that the notifications are routed to the correct service.
Here's an example of how to set up the filters:
Send a POST request to the Notification channel endpoint with a body like the following:
curl -X POST 'https://api.nullplatform.com/notification/channel' \
  -H 'Content-Type: application/json' \
  -H 'Accept: application/json' \
  -H 'Authorization: Bearer <token>' \
  -d '{
   "nrn": "organization=1:account=2:namespace=3:application=4",
   "description": "Telemetry channel for custom provider",
   "source": [
      "telemetry"
   ],
   "type": "agent",
   "configuration": {
      "api_key": "AAAA.1234567890abcdef1234567890abcdefPTs=",
      "command": {
         "data": {
            "cmdline": "/root/services/entrypoint --service-path=$path-to-your-implementation",
            "environment": {
               "NP_ACTION_CONTEXT": "'${NOTIFICATION_CONTEXT}'"
            }
         },
         "type": "exec"
      },
      "selector": {
         "environment": "development" // this selectors must match the agent tags.
      }
   },
   "filters": {
    "$or": [
      {
        "service.specification.slug": {
          "$eq": "$service-specification-slug"
        }
      },
      {
        "arguments.service_id": {
          "$eq": "$service-id"
        }
      }
    ]
  },
}'
Send a POST request using the CLI. See Notification channel endpoint for more details.
np notification channel create \
  --body '{
   "nrn": "organization=1:account=2:namespace=3:application=4",
   "description": "Telemetry channel for custom provider",
   "source": [
      "telemetry"
   ],
   "type": "agent",
   "configuration": {
      "api_key": "AAAA.1234567890abcdef1234567890abcdefPTs=",
      "command": {
         "data": {
            "cmdline": "/root/services/entrypoint --service-path=$path-to-your-implementation",
            "environment": {
               "NP_ACTION_CONTEXT": "'${NOTIFICATION_CONTEXT}'"
            }
         },
         "type": "exec"
      },
      "selector": {
         "environment": "development" // this selectors must match the agent tags.
      }
   },
   "filters": {
    "$or": [
      {
        "service.specification.slug": {
          "$eq": "$service-specification-slug"
        }
      },
      {
        "arguments.service_id": {
          "$eq": "$service-id"
        }
      }
    ]
   }
}'
Example command configuration
Suppose your GitHub organization is acme-corp and you have a repo named telemetry that implements a
provider named grafana. In that case, the script you configure in the channel would be:
/root/services/entrypoint --service-path=/root/acme-corp/telemetry/grafana
Required implementations for metrics
You can implement metrics for services. Use the operations below based on what you need.
Metrics
To implement a metrics provider, define the following operations.
| Operation | Purpose | Workflow Path |
|---|---|---|
| List available metrics | Enumerate available metrics | metric/workflows/list.yaml |
| Read metric | Fetch time-series metrics | metric/workflows/metric.yaml |
Best practices for error handling
Always return valid JSON, even on errors. Use the empty results pattern:
{"metric":"","type":"","period_in_seconds":0,"unit":"","results":[]}
List available metrics
Lists the metrics available from your backend for discovery in the nullplatform UI.
Workflow path
<provider_path>/metric/workflows/list.yaml
Input
The following JSON is provided via the NP_ACTION_CONTEXT environment variable:
{
  "action": "metric:list",
  "entity_nrn": "organization=1:account=2:namespace=3:application=4:scope=5",
  "arguments": {
    "application_id": "4",
    "service_id": "9a4c1f2e-7b8d-4f6a-9c3e-1d2b8e5a6f40"
  },
  "service": {
    "id": "9a4c1f2e-7b8d-4f6a-9c3e-1d2b8e5a6f40",
    "dimensions": {
      "environment": "development",
      "country": "argentina"
    }
  },
  "parameters": {
    "service_id": "9a4c1f2e-7b8d-4f6a-9c3e-1d2b8e5a6f40"
  },
  "tags": {
    "organization_id": "1",
    "organization": "acme-corp",
    "account_id": "2",
    "account": "main",
    "namespace_id": "3",
    "namespace": "acme-namespace",
    "application_id": "4",
    "application": "acme-services-action-app",
    "scope_id": "5",
    "scope": "my-scope"
  }
}
Response format
{
  "results": [
    {
      "name": "http.rpm",
      "title": "Throughput",
      "unit": "rpm",
      "available_filters": [
        "service_id",
      ],
      "available_group_by":[
        "service_id",
      ],
    },
    {
      "name": "http.response_time",
      "title": "Response Time",
      "unit": "ms",
      "available_filters": [
        "service_id",
      ],
      "available_group_by": [
        "service_id",
      ],
    },
    {
      "name": "http.error_rate",
      "title": "Error Rate",
      "unit": "%",
      "available_filters": [
        "service_id",
      ],
      "available_group_by": [
        "service_id",
      ],
    },
    {
      "name": "system.cpu_usage_percentage",
      "title": "CPU Usage",
      "unit": "%",
      "available_filters": [
        "service_id",
      ],
      "available_group_by": [
        "service_id",
      ],
    },
    {
      "name": "system.memory_usage_percentage",
      "title": "Memory Usage",
      "unit": "%",
      "available_filters": [
        "service_id",
      ],
      "available_group_by": [
        "service_id",
      ]
    }
  ]
}
| Field | Type | Required | Description |
|---|---|---|---|
results | array | Yes | Array of available metrics |
results[].name | string | Yes | Metric identifier used in API calls |
results[].title | string | Yes | Human-readable display name |
results[].unit | string | Yes | Unit of measurement for display |
results[].available_filters | array | Yes | Supported filter dimensions |
results[].available_group_by | array | Yes | Supported grouping dimensions |
Read metric
Fetches time-series metric data for visualization and alerting in nullplatform.
Workflow path
<provider_path>/metric/workflows/metric.yaml
Input
The following JSON is provided via the NP_ACTION_CONTEXT environment variable:
{
   "action": "metric:data",
   "entity_nrn": "organization=1:account=2:namespace=3:application=4:scope=5",
   "arguments": {
      "metric": "http.error_rate",
      "start_time": "2026-01-21T18:26:49.689Z",
      "end_time": "2026-01-21T18:56:49.689Z",
      "filters": {
         "service_id": "9a4c1f2e-7b8d-4f6a-9c3e-1d2b8e5a6f40"
      },
      "period": 60,
      "group_by": [],
      "application_id": 4,
      "options": {},
      "service_id": "9a4c1f2e-7b8d-4f6a-9c3e-1d2b8e5a6f40"
   },
   "service": {
      "id": "9a4c1f2e-7b8d-4f6a-9c3e-1d2b8e5a6f40",
      "dimensions": {
         "environment": "development",
         "country": "argentina"
      }
   },
   "parameters": {
      "service_id": "9a4c1f2e-7b8d-4f6a-9c3e-1d2b8e5a6f40",
   },
   "tags": {
      "organization_id": "1",
      "organization": "acme-corp",
      "account_id": "2",
      "account": "main",
      "namespace_id": "3",
      "namespace": "acme-namespace",
      "application_id": "4",
      "application": "acme-services-action-app",
      "scope_id": "5",
      "scope": "my-scope"
   }
}
Supported metric names
The supported metric names are the ones you defined in your metric list implementation.
Response format
{
  "metric": "http.rpm",
  "type": "gauge",
  "period_in_seconds": 60,
  "unit": "count_per_minute",
  "results": [
    {
      "selector": {
        "service_id": "<service-id>",
      },
      "data": [
        {
          "timestamp": "2024-01-15T10:00:00Z",
          "value": 1250.5
        },
        {
          "timestamp": "2024-01-15T10:01:00Z",
          "value": 1340.2
        }
      ]
    }
  ]
}
| Field | Type | Required | Description |
|---|---|---|---|
metric | string | Yes | The metric name |
type | string | Yes | Metric type (gauge, counter) |
period_in_seconds | number | Yes | Data point aggregation period |
unit | string | Yes | Unit of measurement |
results | array | Yes | Array of time series |
results[].selector | object | Yes | Labels identifying the series |
results[].data | array | Yes | Array of data points |
results[].data[].timestamp | string | Yes | ISO 8601 timestamp |
results[].data[].value | number | Yes | Metric value |