Analyze and explore
Any dashboard you own in AI Insights doubles as a starting point for deeper analysis. Open it, use the AI chat panel, and ask questions about the data you see. The assistant reads the dashboard's widgets and returns conclusions, comparisons, and recommendations backed by the live numbers.
The AI chat is only available on dashboards you own. Predefined dashboards and dashboards shared by other team members are view-only, and the chat button isn't available on them.
How it works
- Open one of your own dashboards from the Insights sidebar.
- Click the AI chat icon to open the chat panel.
- Ask a question about what the dashboard shows. The assistant has the full context of every widget, KPI, chart, and table on the dashboard.
- The assistant responds with analysis, highlights, and suggested next steps.
The assistant sees the current data in the dashboard, not a snapshot from when it was created. Your analysis is always based on live numbers.
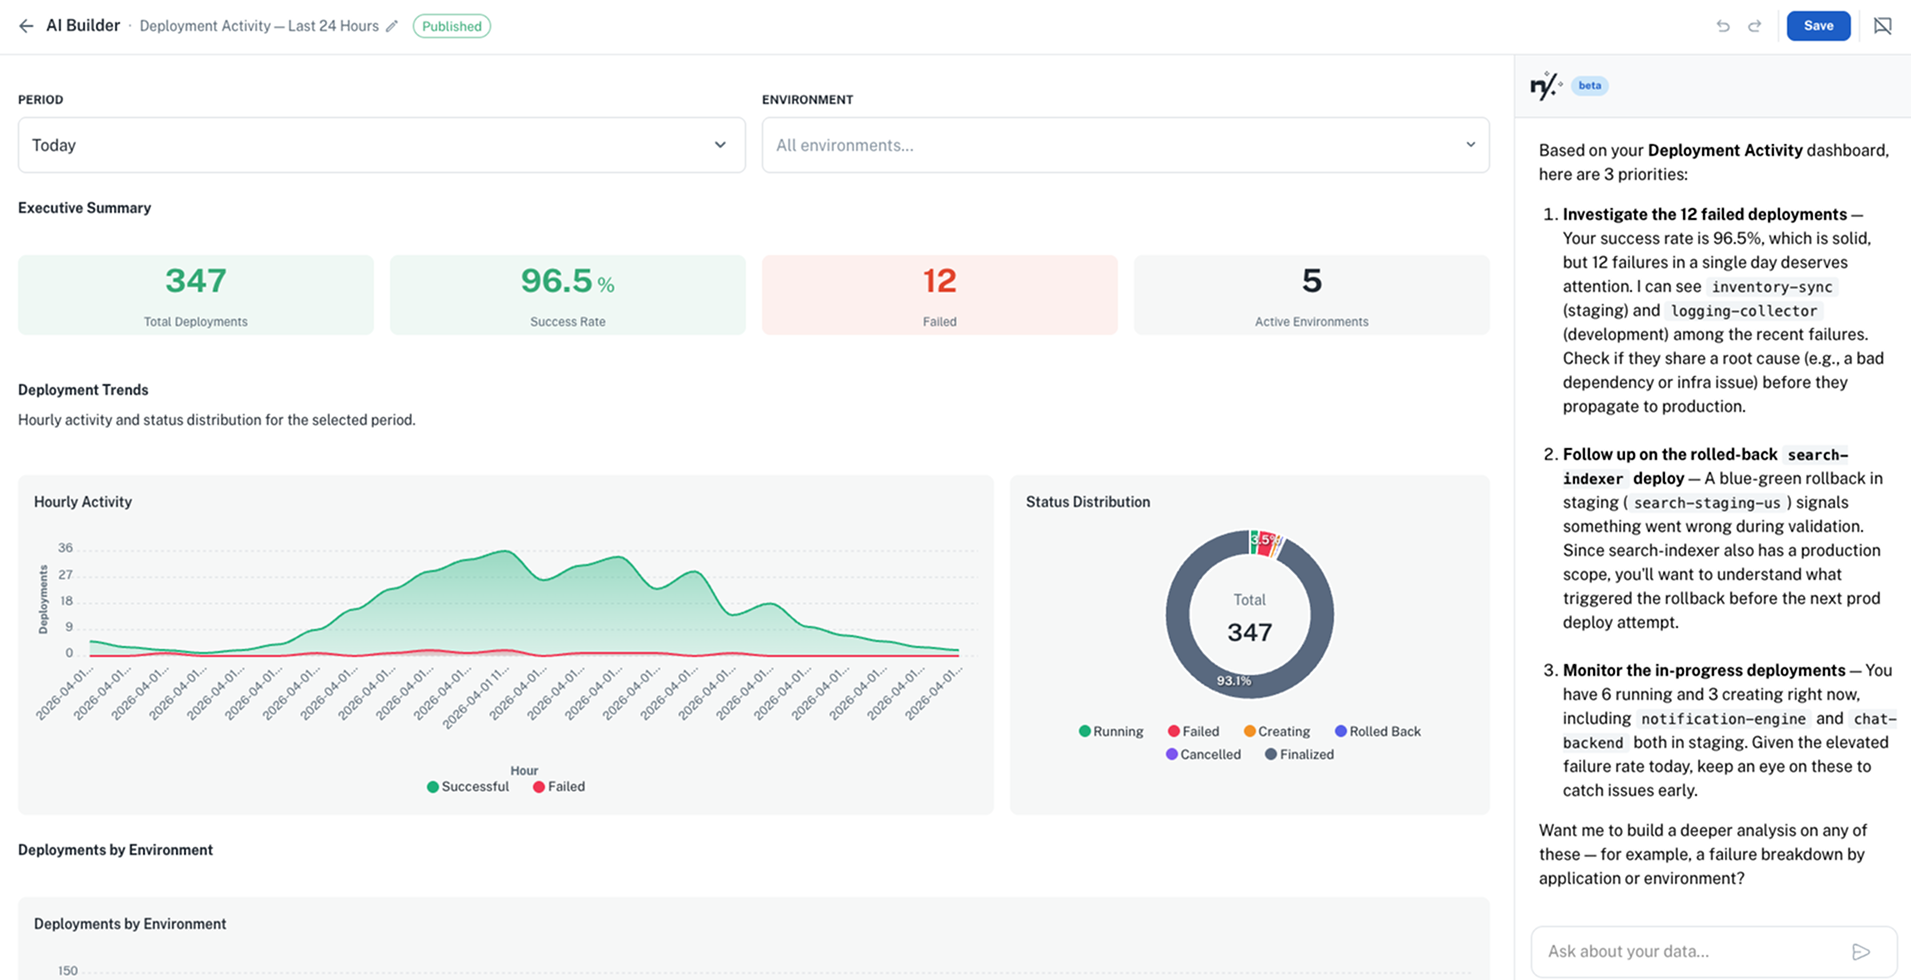
For example, open a deployment health dashboard and ask: "Give me a short list of the key things I should focus on right now, and why." The assistant responds with a prioritized summary based on the live data:
What you can ask
Draw conclusions
Ask the assistant to interpret the data and surface what matters.
Example queries:
- "Analyze this dashboard and draw conclusions about our deployment health"
- "What are the key takeaways from this data?"
- "Summarize the most important trends you see"
- "What should I be worried about based on these numbers?"
Spot anomalies
Ask the assistant to find outliers or unexpected patterns in the data.
Example queries:
- "Are there any anomalies in the last 7 days?"
- "Which service is performing worse than usual?"
- "Flag anything that looks unusual compared to the previous period"
Compare and rank
Ask for comparisons across namespaces, teams, or time periods.
Example queries:
- "Which namespace improved the most this month?"
- "Compare this week's error rate to last week"
- "Rank teams by deployment frequency"
- "How does production compare to staging in terms of failures?"
Get recommendations
Ask for actionable next steps based on the data.
Example queries:
- "What should we prioritize fixing based on this dashboard?"
- "Which applications would benefit most from right-sizing?"
- "Suggest improvements based on the deployment patterns you see"
Tips for better analysis
- Be specific about what you want. "Analyze deployment trends" produces a more focused response than "What do you think?"
- Reference what you see. "The error count in the top-right card seems high, is that normal?" gives the assistant precise context.
- Ask follow-up questions. Start with a broad analysis, then drill into specifics: "Tell me more about the checkout-service errors."
- Combine with time context. "How does today compare to the same day last week?" helps surface trends that single-point data misses.