Insights
AI-powered features are in early release and may not be available in your organization yet. If you'd like to try them or want to know more, reach out to us and we'll get you set up.
AI Insights is a dashboard builder powered by an AI assistant. Ask a question like "Show errors by service in the last 7 days" and the assistant generates a visual dashboard with KPI cards, charts, and tables backed by live platform data. Save your dashboards as private drafts or publish them to your organization.
What you can do
- Build dashboards from natural language: type a question in the AI chat panel and get a visual dashboard instantly. The assistant generates KPI cards, bar charts, pie charts, line charts, and tables.
- Edit and iterate: refine dashboards through follow-up questions in the chat, or manually reorder widgets and change chart types in the editor.
- Share with your organization: publish dashboards so your team can access them from the Insights sidebar. Control visibility: organization-wide or private.
- Use predefined dashboards: access built-in dashboards for Apps & Scopes, Builds, Specs & Instances, Deployments, and DORA metrics without any setup.
The AI assistant
The AI assistant in Insights is dedicated to building and analyzing dashboards. It's separate from the nullplatform AI assistant, which handles platform operations like exploring resources, investigating failures, and generating CLI commands.
The Insights assistant operates in two modes:
- Build mode: generates widgets (KPI cards, charts, tables) from your prompt. See Dashboard builder for the full workflow.
- Analysis mode: reads live data in your dashboards and answers questions about it. See Analyze a dashboard for details.
Roles and permissions
| Role | Permissions |
|---|---|
| Insights admin | Create, edit, publish, and share dashboards. Full write access to all Insights features. |
| Insights viewer | View published dashboards and reports. Read-only access to organization insights. |
Check our Roles docs for more information.
Contact your organization admin to request access if you don't see the Insights button in the console header.
How to access
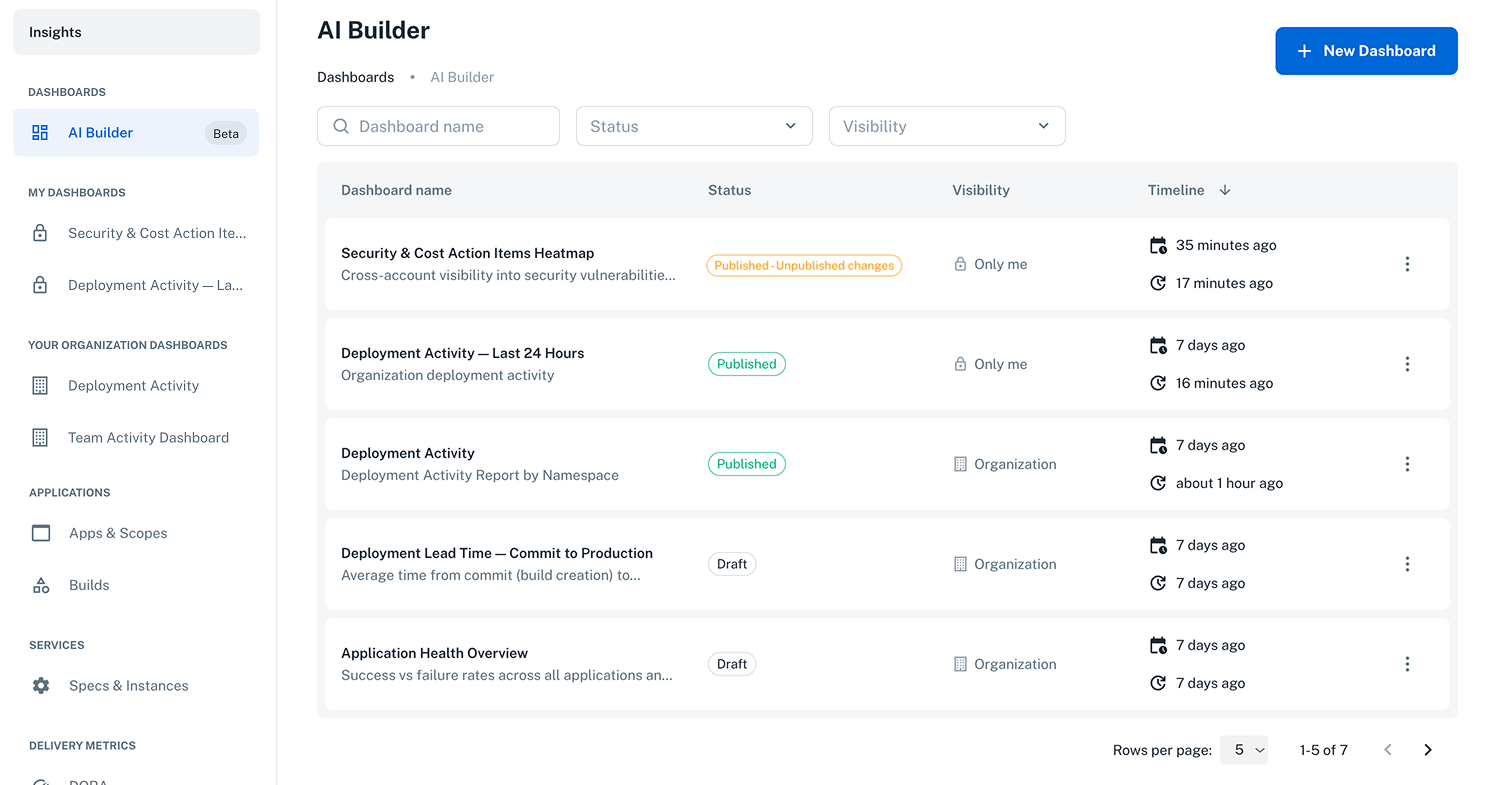
Click Insights in the nullplatform console header to open the dashboard view. From here you can:
- Browse predefined dashboards in the sidebar (Applications, Services, Delivery Metrics).
- Access your published dashboards under My Dashboards in the sidebar.
- See dashboards published by your team under {Organization} Dashboards in the sidebar, read-only for users with the insights viewer role.
- View and manage all dashboards, both drafts and published, from the main list.
- Click + New Dashboard to create a new AI-generated dashboard.
Next steps
| Page | What it covers |
|---|---|
| Dashboard builder | Create, edit, save, publish, and manage dashboards with the AI Builder |
| What you can ask about | Common use cases (team activity, deployments, costs, security) and how to analyze dashboards with the AI chat |
| AI Usage | Monitor token and concurrent session consumption against org and user quotas |
| Track a runtime migration | Tutorial: use Insights AI Builder to build a live migration tracking dashboard in one prompt |